These ten survey tools are ideal for academic research (and market research) because they offer advanced question types, strong reporting features, and support to help make your project a success. This article includes a detailed breakdown of each tool, along with additional resources on survey panels and research distribution methods.
Below is a summary of the ten tools. We’ve included the lowest available upgrade price, typically the tier where research-ready features become available, as well as a short overview of each platform’s standout capabilities. Most survey tools offer a monthly subscription, but we note when annual pricing is required.
| Tool | Upgrade Price | Important Features |
|---|---|---|
| SurveyKing | $19/mo | MaxDiff, conjoint,consulting services, mobile ready Likert scale, various rankings, panel respondents, anonymous link |
| Alchemer | $249/mo (for research questions) | MaxDiff, conjoint, image heat map, text highlighter, continuous sum, semantic differential, panel respondents, advanced reporting, data cleaning |
| SurveyMonkey | $99/mo | Image heatmap, matrix of dropdowns, panel respondents, significant difference, data cleaning |
| Qualtircs | $120/mo (billed annually – for research projects) | MaxDiff, conjoint, card sort/group, continuous sum, image heat map, text highlighter, drill down, panel respondents |
| QuestionPro | Research questions require a custom quote. | MaxDiff, conjoint, continuous sum, image heat map, text highlighter, panel respondents |
| Sawtooth | $4,500 – $11,990 annually. | Specializes in MaxDiff and conjoint. Bandit MaxDiff and Menu based conjoint. |
| Conjointly | $1,795 annually | MaxDiff, conjoint, claims testing |
| Typeform | $29/mo | Beautiful UI, integrations, calculator feature, flow charts for skip logic. |
| Hubspot | Starts at $20/mo | Automations, custom properties |
| Google Forms | Free | Simple and elegant UI, trusted brand name |
Important Features of Research Survey Software
Academic research surveys often require advanced question types to capture the necessary data. Many of the tools we mention in this article include these questions. However, some projects also require specialized features or the ability to purchase a panel. To help guide your decision in choosing the best piece of software for your project, we’ll summarize some of the most critical aspects.
Research Questions
Standard multiple-choice questions can only get you so far. Here are some question types you should be aware of:
- MaxDiff – measure the relative importance of an attribute. It goes beyond a standard ranking or rating by forcing respondents to pick the least and most valued items from a list. The results include a statistical model to give you the probability of an being selected as the most important. Latent class analysis can help you identify groups of respondents who value different attributes.
- Conjoint – Similar to MaxDiff in terms of finding importance, respondents evaluate a complete product (multiple attributes combined). This simulates real world purchasing decisions. A statistical model is also used to compute the importance of each item.
- Van Westendorp – Asks respondents to evaluate four price points. This shapes price curves and gives you a range of acceptable prices.
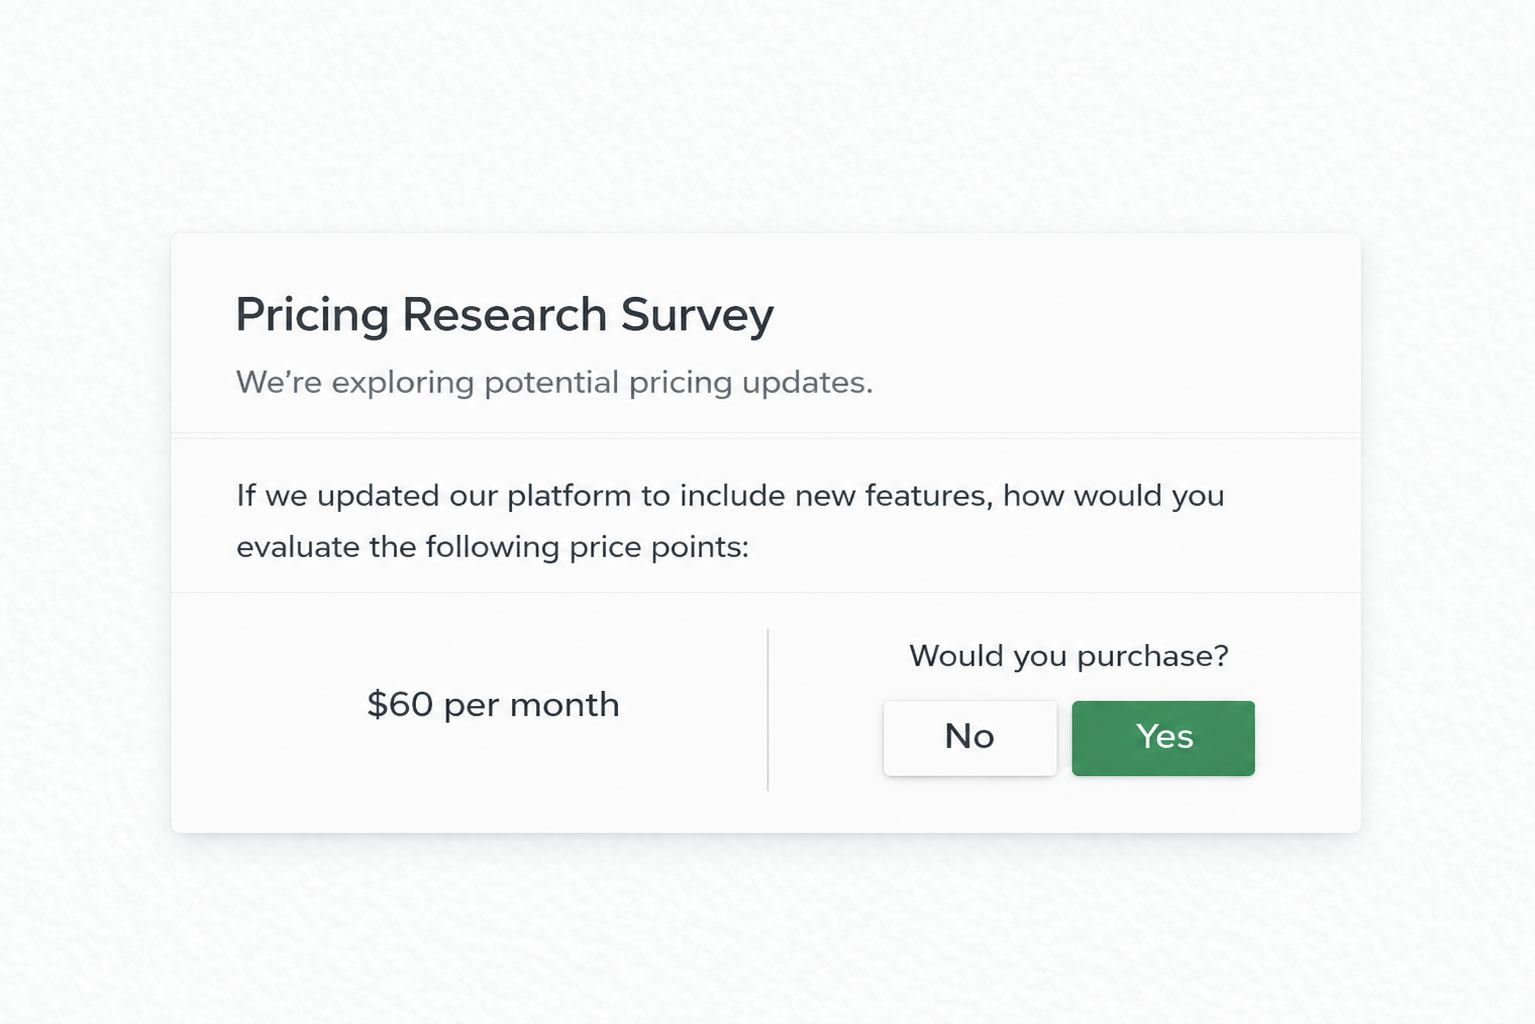
- Gabor Granger – Asks users whether or not they would purchase an item at specific price points. Price points are shown in random order to simulate real-world buying conditions. The results include a demand curve, giving you the revenue-maximizing price.
- Rating scales 1-5 – Measure attitudes and opinions related to a topic. To increase response rates, it’s essential to use a mobile-ready tool; many platforms use a matrix, which is generally not mobile-friendly. This question type also makes it easy to utilize external benchmarks for things like training evaluations.
- Semantic differential scale – a multirow rating scale that contains adjective pairs with opposite meanings (e.g., ‘pleasant – unpleasant’) at each end. It is used similarly to a Likert scale but is much easier for respondents to evaluate.
- Image heat map – Respondents click on places they like on an image. The results include a heat map showing the density of clicks. This is useful for product packaging.
- Net Promoter Score – Respondents choose a rating from 0-10. Many companies use this industry-standard question to benchmark their brand perception. This question type is necessary if your academic project measures brand reputation.
Distribution Methods
Collecting responses is one of the most essential parts of a research survey. You need to choose a tool that offers a wide range of options to collect responses.
One of the most common ways to collect survey responses using survey link. It’s also easy to post on social media or forms like Reddit. You can also add a query string to track where the responses came from.
A QR code survey is another convenient collection method. You can place the QR code on flyers or posters, which is great for an academic setting. The QR code style should be customized to make it stand out and match your brand. Not all survey tools offer the ability to customize the QR code design.
Anonymous surveys are critical for studies involving sensitive topics, where participants may hesitate to provide honest answers unless their identities are fully protected. SurveyKing includes built-in anonymity features, such as a visible seal at the top of each survey, and clearly explains the methodology used to preserve respondent privacy, making it ideal for research environments.
Finally, email surveys are commonly used when you have a distribution list you wish to use to collect responses. An email collector, or a free email marketing platform, will allow you to upload a file (or connect to an email finder tool) and send them by one. This generates a unique link per person and allows you to track metrics on delivery and open rates and send reminders.
Data Segmentation
Comparing two groups within your survey data is essential for many research projects. This is called cross tabulation. For example, consider a survey where you ask for gender along with product satisfaction. You may notice that males are not satisfied with the product while females are.
You can take this further and compute the statistical significance between the groups. In other words, make the differences that exist between two data sets due to random chance or not. Your comparison is statistically significant if it’s not due to random chance.
Some lower-end survey tools may not offer any segmentation features. If this is the case, you need to download your survey data into a spreadsheet and create pivots of set-up custom formulas.
Skip Logic and Piping
If your academic project has questions that only a specific subset of respondents need to answer, then some logic will help streamline your survey.
Skip logic will take you to a new page based on answers to previous questions. Display logic will show a question to a user based on previous questions; perfect for follow-up.
Answer piping will allow you to carry forward answers from one question into another. So, for example, ask someone which brand names they have heard of, then pipe those answers into a ranking question.
Data Cleaning
Ensuring response quality is a critical part of any survey research project. For example, respondents who rush through a survey or select the same option for every question often produce low-quality data that should be removed before analysis. Some survey tools automatically flag these responses, which can be a valuable feature. Data cleansing services can further help identify and remove low-quality responses, preparing your dataset for accurate statistical analysis.
For platforms that do not offer a data cleaning feature, it’s generally possible to export the data to Excel, create formulas for time spent, answer straight-lining, then remove the needed data. You can also include a trap question to help filter out low-quality responses.
Consulting & Support
Many academic projects require statistical analysis or additional options for the survey. Using a tool with a support staff that can explain a statistical model’s intricacies, help build custom models, or adds features on request will ensure your project is a success. With SurveyKing, custom-built features are billed at $100 per hour, making custom projects feasible for small budgets.
Depending on the project type, you may need to conduct data analysis in Excel. Common tasks include cleaning survey data, running regressions, or building interactive dashboards. We’ve reviewed the top Excel consulting services that can help with formulas, VBA automation, dashboard development, and integrations with platforms like SharePoint and Power BI.
1. SurveyKing
SurveyKing is the most affordable and robust research platform for $19/month. MaxDiff, Conjoint, Gabor-Granger, Van Westendorp, and advanced logic are all included at one flat rate, making it dramatically more affordable than other platforms. Consulting support is available at $50/hour, billed as needed.
The survey builder is intuitive, offering question types suited for serious research: mobile-optimized Likert scales, semantic differentials, and anchored MaxDiff with optional open-ended feedback. Cluster analysis tools help group respondents by preference patterns, while advanced filtering and segmentation make reporting easy. Excel exports are formatted for SPSS, and MaxDiff probability outputs provide rare statistical depth for an affordable tool.
SurveyKing also supports anonymous surveys and Net Promoter Score modules, useful for studies on satisfaction, engagement, or brand reputation.
Beyond surveys, SurveyKing offers expert consulting to help plan studies, collect responses, and build statistical models. Whether you’re designing a new project or migrating from Qualtrics or SurveyMonkey, we can help.
For institutions looking to go further, CDO (Chief Data Officer) Services help unify and make sense of academic data. We assist universities and research departments in connecting survey responses with student demographics, program data, and even geographic insights through location intelligence software. This enables deeper segmentation, stronger reporting, and the discovery of new opportunities within existing datasets.
Some limitations include the absence of answer piping, image heat maps, continuous sum questions, and limited automated data cleaning tools.
| Feature | Offered | Notes |
|---|---|---|
| Research questions | Yes | Lacks an image heat map, AB testing, |
| Anonymous surveys | Yes | Contains a seal at the top informing respondents about identity protection. |
| Data segmentation | Yes | No significant difference calculations, no advanced criteria. |
| Survey logic | Yes | No answer piping. |
| Survey panels | Yes | Support generally will setup the backend for you and perform quality checks. |
| Data cleaning | In development | Excel export can be downloaded to calculate time spent and straight-lining answers. |
2. Alchemer
As a platform with lots of advanced question types and a reasonable cost, Alchemer is an excellent tool for academic research. Question types include MaxDiff, conjoint, semantic differential, image heat map, text highlighter, continuous sum, cascading dropdowns, rankings, and card grouping.
Reporting on Alchemer is a standout feature. Not only can you create filters and segment reports, but you can also create those filters and segments using advanced criteria. So if you ask a question about gender and hobby, you can make advanced criteria that match a specific gender and hobby.
In addition, their reporting section also can do chi-square tests to calculate the significant difference between the two groups. Finally, they also have a section where you can create and run your R scripts. This can be useful for various academic research projects as you can create custom statistical models in the software without needing to export your data.
Alchemer is less user-friendly than some other tools. The platform is a little clunky; things like MaxDiff require respondents to hit the submit button to get to the next set. Radio buttons need respondents to click inside of them instead of the area around them.
The pricing is reasonable for a student; $249 a month for access to the research questions. However, if you can organize your project quickly, you may only need one month of access.
| Feature | Offered | Notes |
|---|---|---|
| Research questions | Yes | MaxDiff does give probability or share of preference. |
| Anonymous surveys | No | They do have a setting for anonymous responses to turn off geo tracking, but no specific link telling users the survey is anonymous. |
| Data segmentation | Yes | Includes the ability to create advanced criteria (e.g. combing multiple questions into one rule). |
| Survey logic | Yes | Display and skip logic, along with answer piping. |
| Survey panels | Yes | Dedicated fulfilment team. |
| Data cleaning | Yes | You can quarantine bad responses using their tool in the reporting section. |
3. SurveyMonkey
As the most recognized brand for online surveys, SurveyMonkey is a reliable option for academic research. While the platform does not have any research questions, it offers all the standard question types and a clean user interface to build your surveys.
One advanced question type they do have is the image heat map. Their parent company Momentive does offer things like MaxDiff and conjoint studies, but you would need to contact sales to get a quote, meaning this could be out of budget for students.
The reporting on SurveyMonkey is good. You can easily create filters and segments. You can also save that criterion to create a view. The views enable you to toggle between rules quickly.
One of the main downsides to SurveyMonkey is the cost. For the image heat map and to create advanced branching rules, you need to upgrade to their Premier plan, which costs $1,428 annually. To get statistical significance, you would need their Primer plan, which is $468 annually.
| Feature | Offered | Notes |
|---|---|---|
| Research questions | No | Image heat map is offered under the most expensive plan; other research tools are available under their parent company platform. |
| Anonymous surveys | No | They do have a setting for anonymous responses to turn off tracking, but no specific link telling users the survey is anonymous. |
| Data segmentation | Yes | Statistical significance is only available on an annual plan. |
| Survey logic | Yes | No display logic. Advanced branching rules are available on the Premier plan. |
| Survey panels | Yes | Simple UI to filter demographics. |
| Data cleaning | Yes | There is an option to identify low-quality responses, but it’s only available on the Premier plan. |
4. Qualtrics
As the survey tool known for experience management, Qualtrics has some nice features for research projects. For example, they offer both MaxDiff and conjoint in addition to tools like drill-down, continuous sun, image heat map, and a text highlighter.
Reporting on the tool offers the ability to create filters and segments. For segments, it’s called a report breakout, and it appears there is no ability to create a breakout with advanced criteria. However, filers do allow you for advanced criteria.
There is a custom report builder option to create custom PDF reports. You can add as many elements as needed and customize the information displayed, whether a chart type or a data table.
Overall, Qualtrics could be more user-friendly and may require training. The survey builder and reporting screens could be more cohesive. For example, to add more answer options, you need to click the “plus” symbol on the left-hand side of the question instead of just hitting enter or clicking a button right below the current answer choice. In addition, the reporting section will display things like mean and standard deviation for simple multiple-choice questions before showing simple response counts.
One drawback to Qualtrics is the pricing. For example, you would need to pay $1,440 for an annual plan to use the research questions. But many universities have a licensing agreement with Qualtrics so students can use the platform. When you sign up for a new account, you can select academic use, enter your Edu email, and they will check if your university has a license agreement.
| Feature | Offered | Notes |
|---|---|---|
| Research questions | No | Only available on the $1,440 annual plan. |
| Anonymous surveys | Yes | Even with the anonymous link, you still need to go into options to “anonymize” the survey. Once the option is enabled, there is still no message to respondents that the survey is anonymous. |
| Data segmentation | Yes | No advanced segments, simple report breakouts. The significant difference is only available using a “Dashboard widget”. |
| Survey logic | Yes | Skip and display logic along with answer piping. |
| Survey panels | Yes | Limited information about panels but they are offered. |
| Data cleaning | Yes | More advanced data cleaning methods are available under the custom DesignXM package. |
5. QuestionPro
A survey platform with all the needed research questions, including Gabor Granger and Van Westendorp, QuestionPro is a quality research tool.
The reporting on QuestionPro is comprehensive. They offer segment reports with statistical significance using a t-test. In addition, they offer TURF analysis to show answer combinations with the highest reach.
For conjoint, offer a market simulation tool that can forecast new product market share based on your data. That tool can also calculate how much premium consumers will pay for a brand name.
QuestionPro is a little easier to use than Qualtrics. The UI is cleaner but still clumsy. You must navigate to a different section in the builder for things like quotas instead of just having it near skip logic rules. The distribution page has the link at the top but an email body below. The reporting has a lot of different pages to click through for each option. Small things like this mean there is a learning curve to use the platform efficiently.
The biggest downside of QuestionPro is the price. All of their research questions, even Net Promoter Score, would require a custom quote under the research plan. There another plan with upgraded feature types is $1,188 annually.
| Feature | Offered | Notes |
|---|---|---|
| Research questions | Yes | Requires a custom quote. |
| Anonymous surveys | No | You can enable a no-tracking option for email invitations. |
| Data segmentation | Yes | Includes t-tests for statistical significance. Can make segments with multiple criteria. |
| Survey logic | Yes | Skip and display logic along with answer piping. |
| Survey panels | Yes | Limited information about panels but they are offered. |
| Data cleaning | Yes | Requires a custom quote. |
6. Sawtooth
When it comes to advanced research projects, Sawtooth is a great resource. While their survey builder is a little limited in question types, they offer different forms of MaxDiff and conjoint. They also provide consulting services, which could help if your academic project is highly specialized.
For MaxDiff, they offer a bandit version, which can be used for MaxDiff studies with over 50 attributes. Each set of detailed attributes that are most relevant to the user. This can save panel costs because you can build a suitable statistical model with 300 bandit responses compared with 500 or 1000 standard MaxDiff responses.
Their MaxDiff feature also comes with a TURF analysis option that can show you the possible market research of various attributes.
For conjoint, they offer adaptive choice-based conjoint and menu-based conjoint. Adaptive choice tailors the product cards toward each respondent based on early responses or screening questions. Menu-based conjoint is for more complex projects, allowing respondents to build their products based on various attributes and prices.
Sawtooth has a high price point and may be out of the research for many academic projects. The lowest plan is $4,500 annually. If you need advanced tools like bandit MaxDiff or adaptive conjoint, you must pay $11,990 annually. They do have a package just for MaxDiff starting at $2,420.
| Feature | Offered | Notes |
|---|---|---|
| Research questions | Yes | Starts at $4,500 annually. |
| Anonymous surveys | No | N/A |
| Data segmentation | No | No statistical significance |
| Survey logic | Yes | Skip logic. No display logic, as each question is one at a time. Answer piping requires a custom script. |
| Survey panels | No | Thier team can help you source panel. |
| Data cleaning | Yes | Available in their Lighthouse Studio for $11,990 per year. |
7. Conjointly
Conjointly is a platform geared towards research projects, namely market research. Not only do they have the standard research questions, but they also have a bunch of unique ones: claims testing, Kano Model testing, and monadic testing. There are also question types like feature placement matrix, which combines MaxDiff and Gabor Granger into a single question.
You can either use your respondents or select from a survey panel. The survey panel option comes with predefined audiences, which makes scouring respondents a breeze.
One unique feature is that they monitor in real-time speeders and other criteria for low-quality respondents. If a respondent is speeding through the survey, a warning message is displayed asking them to repeat questions before being disqualified. If a question has a lot of information to digest, the system automatically pauses, forcing the respondent to thoroughly read the question before answering.
Conjointly pricing is a little steep at $1,795 annually. Response panels for USA residents appear to start around $4 per completed response. The survey builder and reporting section could be cleaner, with different options in many places. It may take time to get up to speed.
| Feature | Offered | Notes |
|---|---|---|
| Research questions | Yes | Cost is $1,795 annually for all question types. |
| Anonymous surveys | No | N/A |
| Data segmentation | No | No statistical significance. But excellent layouts to compare things like MaxDiff importance between groups. |
| Survey logic | Yes | Display logic only since each page only contains one question. |
| Survey panels | Yes | Many predefined audience types make selecting criteria a breeze. |
| Data cleaning | Yes | Automatic monitoring as respondents are taking the survey. doesn’t appear to be any built-in logic for straight-lining answers. |
8. Typeform
While Typeform doesn’t have any research questions, it is a very well-designed and easy-to-use tool that can assist with your academic survey. For example, it could gather preliminary data for a MaxDiff study.
Typeform offers a lot of integrations with other applications. For example, if your project requires exporting data to a spreadsheet, then Google Sheets or Excel integration might be helpful. Likewise, if your research project is part of a class project, then the Slack or Microsoft Teams integration might help to notify other team members when you get responses.
One unique feature of Typeform is the calculator feature. Add, subtract, and multiply numbers to the @score or @price variable. These variables can be recalled to show scores or used in a payment form.
The reporting in Typeform is basic. There is no option to create a filter or a segment report. Any data analysis would need to be done in Google Sheets or Excel.
For $29 a month, you can get 100 responses, or $59 a month, you can collect 1,000 responses each month.
| Feature | Offered | Notes |
|---|---|---|
| Research questions | No | N/A |
| Anonymous surveys | No | N/A |
| Data segmentation | No | All data analysis would need to be done with the export. |
| Survey logic | Yes | Includes a flow chart to help keep track of logic jumps. |
| Survey panels | No | N/A |
| Data cleaning | No | N/A |
9. HubSpot
HubSpot’s form builder doesn’t include advanced research questions, but it is customizable and easy to use. You can pick between multiple form types, like standalone, embedded, and pop-up forms. There are also numerous templates including lead generation, support, or eBook download forms.
One of the form builder’s main advantages is that it offers native integrations with Salesforce and HubSpot CRM tools. In addition, you can add custom properties to the form from the CRM fields. You can then send the surveys in bulk to your audience using their email features.
If you’re a large academic institution, HubSpot would be ideal to organize and manage a large distribution list. If you need advanced questions, you can still use HubSpot for an initial screener survey or incorporate other surveys into HubSpot using skip logic.
Scalability can be challenging with this tool. Although you can use the form builder for free, you’ll have to subscribe to one of HubSpot’s Marketing Hub paid plans to access more advanced functionalities, like unlimited automation workflows and code customization. There are steep pricing differences between paid packages.
| Feature | Offered | Notes |
|---|---|---|
| Research questions | No | N/A |
| Anonymous surveys | No | You can select not to collect email addresses in the survey builder. |
| Data segmentation | No | No statistical significance, but can segment form data based on numerous filters. |
| Survey logic | Yes | Skip and display logic via progressive and dependent form fields. No answer piping. |
| Survey panels | No | You can send forms to custom audiences via the platform’s CRM and email marketing tools |
| Data cleaning | No | N/A |
10. Google Forms
One of the widely used survey tools, Google Forms, is a decent platform for an academic research survey. Unfortunately, the software doesn’t offer any research questions. Still, the few questions it has, like multiple choice, rantings, and open-ended feedback, are enough to collect essential feedback for simple projects or preliminary data for more complex studies.
Skip logic is straightforward to set up on Google Forms. For example, you can select what section to skip based on question answers or choose what to skip once a section is complete. Of course, you can’t create complex rules, but these simple rules can cover many bases.
Overall the user interface is elegant and straightforward. The form design is also elegant, meaning the respondent experience is excellent. Unlike other survey tools, which can have a clunky interface, there is no worry about that with Google Forms; respondents can quickly navigate your form and submit answers.
The spreadsheet export is very well formatted and can be easily imported into SPSS for advanced analysis. However, the export has the submission date and time but has yet to have the time started, so calculating speeders is impossible.
| Feature | Offered | Notes |
|---|---|---|
| Research questions | No | N/A |
| Anonymous surveys | No | You can choose not to collect email addresses under settings. |
| Data segmentation | No | All data analysis would need to be done with the export. |
| Survey logic | Yes | Simple skip logic based on question answers or sections. |
| Survey panels | No | N/A |
| Data cleaning | No | N/A |
Additional Research Tools
Before deep diving into the survey software list, here are some additional tools and resources that might assist in your project. These can help shape your survey by conducting preliminary research or using it as a substitute if conducting a study is not feasible.
Survey Panels
A panel provider will enable you to target a specific demographic, job role, or hobby type. When setting up a survey with a penal provider, you always want to include screening questions (on the first page) to ensure they meet your criteria, as panel filters may not be 100% accurate. Generally, panel responses start around $2.50 per completed response.
Cint is one of the largest panel providers and works well with any survey platform. Prolific is another panel provider focused on sourcing high-quality respondents. They cost a little more, but depending on the importance of your study, it may be well worth it.
Research Platforms
- Hotjar – They offer simple surveys and many tools to help capture feedback and data points from a website. A feedback widget customized for websites in addition to a heat map tool to show where users click the most or to identify rage clicks. A tool like this could be helpful if your academic projects revolve around launching or optimizing a website.
- Think with Google – Used to help marketers understand their audience. The site contains links to Google Trends to search for the popularity of key terms over time. They also have a tool that helps you identify your audience based on popular YouTube channels. Finally, they have a “Grow My Store Tool” that recommends tips for improving an online store.
- Google Scholar – A specific search engine used for scholarly literature. This can help locate research papers related to the survey you are creating.
- MIT Theses – Contains over 58,000 theses and dissertations from all MIT departments. The database is organized by department and lets you search for keywords.

Ready To Start?
Create your own survey now. Get started for free and collect actionable data.