Pricing studies quantify what customers are willing to pay for a product or a service. The goal is to find pricing that balances profitability with customer value.
Use this pricing survey template to launch a pricing study and identify optimal price points for your product or service. SurveyKing offers the tools needed to conduct expert pricing studies. This guide covers pricing research methodologies, use cases, and what tools to use.
Pricing research methods:
- Survey-Based: Van Westendorp, Gabor–Granger, Conjoint, Price Laddering, Usage-Based
- Experimental: Painted Door Testing, Monadic Price Testing, Price Bracketing, Sequential Price Testing, Dynamic Pricing
- Market-Based: Competitor Pricing Analysis, Price Perception Mapping, Trade Area Analysis
- Finance-Driven: Cost-Plus, Break-Even, Target ROI, Tiered Pricing
Pricing research by use case:
- Setting an initial price point: Van Westendorp, supported by Gabor Granger (to model revenue and demand scenarios), painted door testing
- Optimizing price for an existing product: Gabor Granger, Monadic Price Testing, or price bracketing
- Designing bundles or tiers: Conjoint analysis + tiered pricing models
- Pricing in complex sales environments (B2B): Cost-plus analysis + survey-based validation
- Pricing for new markets: Survey-based pricing research + competitor pricing + trade-area analysis
Survey Based Pricing Research
Surveys are a cost-effective way to gather pricing insights. When properly designed, they reveal willingness to pay, price sensitivity, and value perceptions. Pricing questions are a subset of research questions, and, when properly utilized, they uncover not only optimal price points but also customer preferences and decision drivers.
Van Westendorp Price Sensitivity Meter
The Van Westendorp methodology uses four key questions to determine acceptable price ranges:
- What price would you consider this product/service too expensive? (too expensive)
- What price would you consider this product/service so expensive that you would not consider buying it? (expensive)
- What price would you consider this product/service a bargain? (bargain)
- What price would you consider this product/service so inexpensive that you would question its quality? (too cheap)
By plotting these responses on a graph, you can identify:
- The optimal price point (intersection of “too cheap” and “too expensive”)
- The indifference price point (intersection of “bargain” and “expensive”)
- The acceptable price range
Pro tip: Include product descriptions and visuals in your survey to ensure respondents understand precisely what they’re evaluating.
Works best for: New product launches and services with few direct comparisons, such as innovative software solutions, subscription services, or specialized consulting packages.
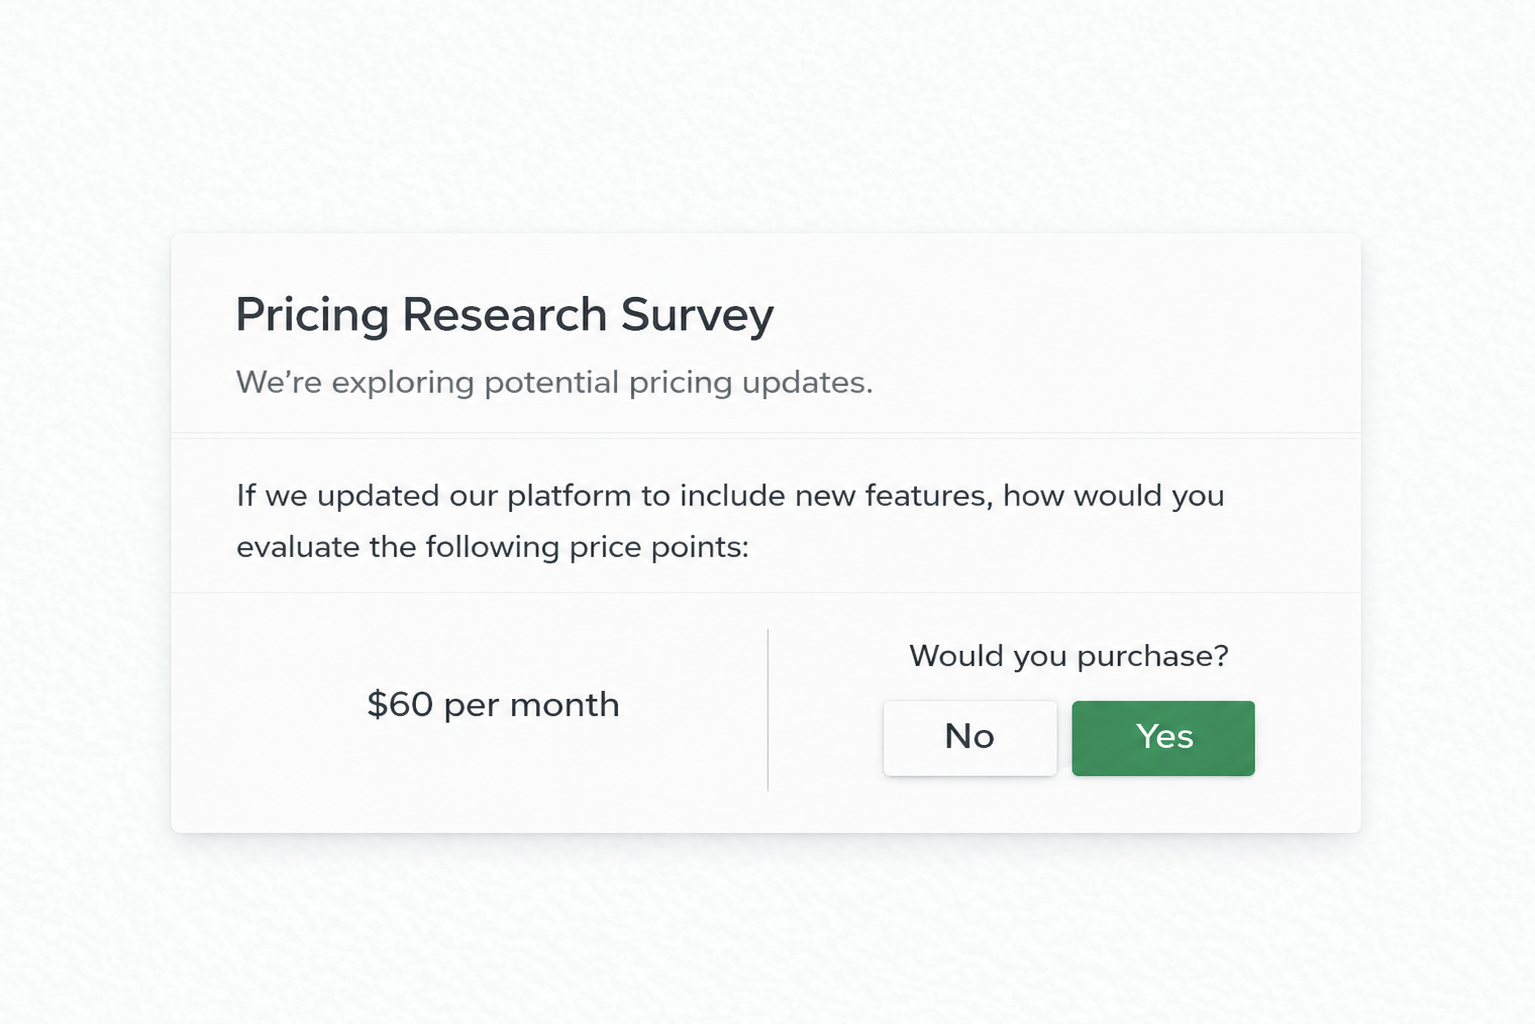
Gabor Granger Technique
The Gabor-Granger approach determines revenue-maximizing price points, willingness to pay, and price elasticity by asking respondents whether they would purchase a product at various price levels. This is how it works:
- Present your product or service with a specific price
- Ask if the respondent would purchase at that price (yes/no)
- If yes, increase the price and repeat until they decline
- If no, decrease the price and repeat until they accept
Here is a quick example. You can ask: “Would you purchase this software subscription at $49 monthly?”
- If yes: “Would you purchase it at $59 monthly?”
- If no: “Would you purchase it at $39 monthly?”
This pattern would then repeat until the highest acceptable price is identified or the respondent refuses to pay.
Works best for: Standard consumer products with clear competitors, like household items, food products, or standardized services. Customers can easily make yes/no purchase decisions based primarily on price.
Conjoint Analysis
Conjoint analysis is useful for products with multiple features or service tiers. This technique:
- Presents respondents with different product configurations (varying features and prices)
- Asks them to make choices or rank preferences
- Uses statistical analysis to determine the value customers place on each feature
Conjoint analysis reveals which features justify premium pricing and which have minimal impact on willingness to pay. It’s beneficial when developing tiered pricing models.
Pro tip: Limit the number of attributes tested to prevent survey fatigue (ideally 4-6 characteristics with 2-5 levels each).
Works best for: Software packages, mobile phone plans, or customizable professional services. Great for determining which specific features justify premium pricing.
Price Laddering
Price laddering is not a traditional survey-based pricing method. It is typically conducted through one-on-one interviews or small, targeted qualitative studies to understand the underlying motivations behind pricing preferences. Teams often use price laddering alongside survey-based pricing research to interpret results and refine messaging.
- Present a price point
- Ask if the respondent would pay that amount
- Ask why or why not
- Probe deeper with follow-up questions to uncover underlying value perceptions
Price laddering helps identify the emotional and functional benefits customers associate with your pricing, which can help with marketing messaging.
Works best for: Luxury goods, premium services, or brand-focused offerings where emotional and psychological factors heavily influence purchasing decisions.
Usage-Based
Usage-based segmentation strengthens pricing research by grouping customers based on how they use a product or service. Usage can be captured through surveys or product analytics and applied in survey-based pricing methods such as the Van Westendorp or Gabor-Granger methods. This approach helps identify natural pricing thresholds, refine tiers, set usage caps, and validate which features justify premium pricing across different usage groups.
Experimental Pricing Research
While surveys ask customers what they might do, experimental methods observe what they do when faced with real pricing decisions.
Painted Door Testing
Painted door testing validates pricing by presenting a real offer with a clear price and call to action before the product or service is fully built. Instead of asking what customers would pay, you observe actual behavior, clicks, inquiries, or purchase attempts to measure willingness to pay. This approach is especially useful for new offerings or high-value B2B services where traditional testing is limited.
Monadic Price Testing
Monadic price testing is a between-group pricing experiment where different customer segments are exposed to various price points, with each respondent seeing only one price. In practice, this is equivalent to an A/B pricing test.
This controlled design isolates price as the only variable, allowing teams to measure the causal impact of pricing changes. In survey-based studies, monadic testing captures stated purchase intent; in live environments, the same approach observes actual purchasing behavior.
When running monadic pricing tests, focus on metrics such as conversion rate, average order value, revenue per visitor, and cart abandonment. These indicators provide direct evidence of how pricing influences customer behavior.
For accurate results:
- Run tests with statistically significant sample sizes
- Test one variable at a time
- Use random assignment
- Run tests long enough to account for seasonality (at least 2-4 weeks)
Pro tip: For B2B companies where each deal is significant, consider testing different pricing proposals with similar prospects rather than randomizing on your website.
Price Bracketing
This technique presents customers with three pricing options:
- Low-priced option (entry-level)
- Mid-priced option (target option)
- High-priced option (premium)
The goal is to make the target option seem like the best value. You can gauge price sensitivity and optimize your pricing tiers by analyzing which option customers select. Many customers avoid the cheapest and most expensive options, gravitating toward the safe middle option.
Sequential Price Testing
Sequential price testing is an alternative to simultaneous monadic price testing and works well if you want to optimize your pricing strategy over time.
First, you establish a baseline price and measure customer response. Then, you make a strategic adjustment, either raising or lowering the price, and carefully track the impact on key metrics like conversion rates, average order value, and total revenue.
While slower than monadic price testing, sequential testing can be more practical for businesses with limited traffic or where simultaneous testing isn’t feasible.
Dynamic Pricing
Dynamic pricing is a strategy where prices adjust in real-time based on variables like demand, inventory, competitor pricing, user behavior, or even time of day. While commonly associated with tech giants like Amazon or Uber, dynamic pricing is increasingly accessible to smaller businesses thanks to modern pricing tools and APIs.
Unlike monadic price testing or sequential pricing, which rely on controlled experiments, dynamic pricing engines react instantly to changing conditions, maximizing revenue opportunities as they arise.
Common Types of Dynamic Pricing:
Demand-Based: Prices rise when demand increases (e.g., Uber surge pricing or ticket platforms during peak events).
Time-Based – Prices adjust by hour, day, or season (e.g., hotel rates, booking platforms).
Inventory-Based: As supply decreases, prices increase to protect margin (e.g., low-stock notifications trigger price bumps).
Behavioral-Based – Prices adjust based on user engagement, past purchases, or session activity (commonly used in SaaS and e-commerce).
Rule-Based: If product stock < 20, increase price by 10%.
Pro Tip: Tools that automate dynamic pricing are available for larger retailers or enterprise use cases, but most businesses benefit far more from foundational research before investing in automation. As your business scales, consider building simple in-house algorithms to create dynamic pricing models tailored to your data. This offers far more flexibility and control than most off-the-shelf tools can provide.
Market-Based Pricing Research
To position your product or service, you must understand how your pricing fits the broader market context.
Competitor Pricing Analysis
Competitor pricing analysis involves systematically gathering data on competitor pricing:
- Identify direct and indirect competitors
- Document their pricing models (one-time, freemium, bundle, subscription-based billing, etc.)
- Track their price points for comparable offerings
- Note any discounting strategies or promotions
- Analyze how their pricing aligns with their positioning
Gathering reliable data on competitor pricing typically combines both public and behind-the-scenes intelligence gathering, like:
- Mystery shopping – Involves experiencing your customers’ pricing as genuine customers would. This approach helps you understand the listed prices and the buying experience, including discounts, package deals, or upsell attempts. This might mean signing up for a free trial to understand the whole pricing structure for subscription services.
- Public pricing pages – You research pricing through readily accessible information about competitor base rates and pricing structures. Monitoring competitor pricing pages regularly lets you learn about patterns in pricing updates and seasonal promotions.
- Sales team intelligence – Your sales team regularly hears feedback about competitor pricing during deals and negotiations, including details about special offers, discounting thresholds, and deal sweeteners that may not be public knowledge. Create a simple process for sales teams to document and share.
- Industry reports – Reports by market research firms and trade associations often contain detailed pricing analyses that would be tough to compile. They typically include average price points, market trends, and sometimes specific competitor information that helps you benchmark your pricing strategy against broader market movements.
- Partner or supplier insights – Your partners and suppliers can provide unique visibility into competitor strategies (especially if you share distribution channels or supply chain partners). Distributors, retailers, and suppliers often work with multiple competing products and can share intelligence about pricing movements throughout your industry ecosystem.
Price Perception Mapping
Price perception mapping surveys are tools used to understand how customers perceive the price and value of a product or service compared to competitors. The goal is to map out where your brand stands in the consumer’s mind on two main axes:
- X-axis: Perceived price (low to high) – Is your product considered cheap, reasonably priced, or expensive?
- Y-axis: Perceived value/quality (low to high) – Is your product considered low quality, average, or premium?
Respondents are shown your product/service and competing ones and get questions like:
- “How would you rate the price of this product?”
- “Do you believe this product is good value for money?”
- “Which brand offers the best quality for the price?”
This creates a perceptual map that helps businesses spot pricing mismatches, identify opportunities for positioning, and understand competitive threats.
Trade Area and Location-Based Pricing
Prices aren’t one-size-fits-all. Customers in different geographic regions may have dramatically different price sensitivities, influenced by income, competition, local expectations, and even cultural norms. Trade area and location-based pricing research helps uncover these regional differences so you can adjust pricing by market without guessing.
Start by collecting geographic data alongside your pricing research. This could be as simple as asking for ZIP codes in a survey or geotagging user responses. Then, overlay that data with external variables such as:
- Census income data
- Population density
- Competitor presence in the region
- Cost of living indexes or sales tax rates which can affect the final price customers pay at checkout.
By comparing results from tools like Van Westendorp or Gabor-Granger across different regions or cities, you can identify location-specific willingness to pay.
Imagine you run a SaaS product and run Gabor-Granger pricing research in several regions. You discover customers in Austin, TX are comfortable paying $129/month.
Rather than limiting that insight to Austin alone, you analyze key demographic and economic traits:
- Median income: $85,000+
- High concentration of tech professionals
- Urban/suburban mix
- High cost of living
- Above-average education levels
Next, you identify other U.S. markets with similar profiles, like Raleigh, NC; Boulder, CO; and parts of the Seattle metro. Using external data from the U.S. Census, IPUMS, or ESRI Business Analyst, you cluster these areas into a pricing zone.
Even if you haven’t run pricing surveys in those secondary markets, you can confidently apply a $129/month pricing tier based on similar demand profiles.
This approach:
- Extends the reach of your pricing data
- Reduces the need for surveys in every region
- Supports smart regional pricing without guesswork
Finance-Driven Pricing Research
Even the best pricing strategies must be grounded in financial reality. These pricing frameworks focus on internal cost structures, margin goals, and ROI targets to ensure your pricing supports long-term profitability.
Pricing research can support financial planning decisions, including whether taking out an online business loan makes sense without putting pressure on margins or long-term profitability.
Your accounting systems need to produce clean, accurate data to support finance-driven pricing. This includes reliable COGS tracking, overhead allocation, and revenue categorization, which support calculations such as break-even volume, contribution margin, and return on investment. Maintaining strong financial controls, including financial crime compliance, ensures that your pricing decisions are not only profitable but also adhere to legal and regulatory standards.
In practice, teams often use spreadsheet automation or VBA development services to consolidate data from multiple sources and standardize pricing inputs.
Cost-Plus Pricing
Add a fixed markup to your total costs (COGS + overhead) to ensure every sale contributes to profit. This method is simple and predictable. It works well for services, manufacturing, and professional consulting.
Limitation: Ignores customer perception or market dynamics
Break-Even Pricing
Set prices based on how many units you need to sell to cover your fixed and variable costs. This is useful for launching new products, promotions, or market entry. Great for scenario modeling (price X, sell Y = profit Z)
But this method doesn’t guarantee a margin; it only covers costs.
Target ROI Pricing
The pricing would be set to meet a desired return on investment based on projected sales volume and total costs. This method is often used in consulting, SaaS, or capital-heavy industries. It encourages strategic thinking beyond one-time sales. If not tested properly, this method can result in higher prices than the market will bear, so prices using this method should constantly be monitored.
Tiered Pricing
Create product tiers with built-in margin goals. Higher tiers yield higher profit per unit. This method is standard in DTC, SaaS, and packaged services and helps structure “good-better-best” pricing ladders. Price packages must include clear value differentiation to use this method.
Designing Effective Pricing Studies
The quality of your pricing research depends heavily on your survey’s design. A poorly constructed study can introduce bias, reduce data reliability, or completely miss the fundamental drivers of willingness to pay.
Designing a strong pricing study is critical to landing on the right price. Even small improvements matter, a 1% improvement in pricing can lead to an 11% increase in profitability (McKinsey), and 72% of new products fail to meet revenue targets due to ineffective pricing (Simon-Kucher & Partners, 2024).
Use the following best practices to ensure your pricing surveys produce clean, actionable insights:
- Start with screening questions – Ensure respondents match your target audience. Ask qualifying questions upfront to filter out irrelevant participants.
- Provide adequate product context – Use detailed descriptions, images, or videos, so respondents clearly understand what they’re evaluating. Ambiguity leads to noise in your results.
- Use a mix of question types – Combine direct pricing questions (such as Van Westendorp or Gabor-Granger) with MaxDiff and usage data to segment pricing by the features customers actually use, which is critical for usage-based pricing.
- Include pricing reference points – Help respondents anchor their responses by referencing similar products or prior pricing they’ve encountered, which is beneficial when testing new products.
- Segment questions by buyer persona – Different customer types often value different things. Tailor your questions or your analysis by segment to uncover more precise pricing insights.
- Add open-ended questions – Capture qualitative data on why customers feel a product is under or over-priced. This can reveal emotional triggers and messaging angles for your offer.
- Keep it concise – Avoid survey fatigue by focusing on high-impact questions. Prioritize clarity, relevance, and flow, especially when testing more advanced methods like conjoint or price laddering.
Pro Tip: Test your survey internally before launch. Even one unclear question can distort your results across hundreds of respondents.
If you plan to collect responses from current customers consider an email finder to verify your customer list prior to sending the study.
Remember that pricing research isn’t a one-time event but an ongoing process. Markets evolve, competitors adjust, and customer perceptions shift. Businesses that consistently outperform their competitors make pricing research a core component of their strategic planning process.
Common Pricing Terminology
Understanding core pricing terms helps you interpret research results and build sustainable models. Here are key concepts every business should know:
- COGS (Cost of Goods Sold): The direct costs required to produce and deliver your product or service, including materials, labor, and shipping.
- Contribution Margin: What’s left from each sale after subtracting variable costs. It’s the money available to cover fixed costs and generate profit.
- Break-Even Point: The sales volume where total revenue equals total cost is used to determine how much you need to sell to cover expenses.
- Price Elasticity: How sensitive customer demand is to price changes. Products with high elasticity lose sales quickly when prices rise.
- Price Sensitivity: A customer’s responsiveness to price differences or changes often varies by persona or market.
- Customer Lifetime Value (CLV): The total revenue a customer is expected to generate over their entire relationship with your business. Essential for setting sustainable price points.
- Customer Acquisition Cost (CAC): The average cost of acquiring a new customer, including marketing, sales, and onboarding expenses.
- ARPU (Average Revenue per User): Total revenue divided by number of customers. Helpful in evaluating pricing tiers, upsells, and monetization efficiency.
- Churn Rate: The percentage of customers who cancel or stop buying over a given period. High churn often signals pricing misalignment or weak value delivery.
How to Conduct Pricing Research
Pricing research works best when it follows a structured process. The goal is not just to collect data, but to generate insights that flow into financial reporting, forecasting, and strategic decision-making.
Step 1: Define Your Pricing Strategy Inputs
Before launching a study, clarify the fundamentals:
- Identify your target customer segments
- Define your margin goals by tier
- Review competitor pricing and positioning
- Decide whether pricing should vary by region or trade area
Clear inputs ensure your research is grounded in real business constraints.
Step 2: Run the Right Pricing Study
Select the method that matches your objective:
- Gabor-Granger or Van Westendorp for price sensitivity
- Conjoint for trade-offs and feature-level valuation
- Direct pricing surveys for perception and positioning
At this stage, ensure you are capturing structured feedback tied to specific price points.
Step 3: Track Pricing KPIs
Once pricing is live, monitor performance monthly. Go-to-Market (GTM) software can help track metrics such as:
- Monthly recurring revenue (MRR)
- Churn rate
- CAC payback period
- Gross margin by tier
- Price testing win rates
- Revenue by customer segment
Tracking these metrics ensures pricing decisions are tied to measurable outcomes.
Step 4: Integrate Into Financial Models
Pricing research is most powerful when it feeds into forecasting and scenario planning. Acceptable price ranges, demand curves, and price thresholds should become inputs into broader revenue models.
Our financial modeling services help integrate pricing assumptions with CAC, churn, margin targets, and growth scenarios to quantify the impact of pricing decisions and align teams around data-driven outcomes.
Step 5: Align With Revenue Leadership
If pricing research surfaces broader questions about packaging, positioning, or go-to-market execution, it may require leadership-level ownership. Pricing decisions often connect to segmentation, sales motion, and long-term growth strategy.
In those cases, CRO consulting services can help translate pricing research into a cohesive revenue strategy, align cross-functional teams, and support executive decision-making.

Ready To Start?
Create your own survey now. Get started for free and collect actionable data.