Overview: Use this demographics survey template to collect background information such as age, gender, income, education, occupation, and location, adding context to results and revealing patterns across groups. Demographic data is commonly used to inform product strategy, marketing decisions, and location-based expansion.
- Online survey template – Create and launch the form instantly using an online survey tool.
- Word document template – Copy, edit, and customize questions before deploying the survey.
Demographic Survey Questions
Demographic questions are grouped into common categories. Each category below includes question wording and common answer choices to help you design your survey. It’s best to always include a Prefer not to answer option to respect privacy and reduce nonresponse.
1. Age
Age is one of the most common demographic questions, essential for segmentation and anticipating how needs shift across life stages. It’s best to ask for an age range.
Question: What is your age range?
- 17 or younger
- 18–24
- 25–34
- 35–44
- 45–54
- 55–64
- 65–74
- 75 or older
- Prefer not to answer
Pro tip: You can also group by generational cohorts (Gen Z, Millennials, Gen X, Baby Boomers) depending on your research goals. You could also just include a number input and ask for birthyear.
2. Gender
Preferences, needs, and decision-making drivers vary across gender groups. Knowing how different identities engage with your brand helps avoid one-size-fits-all assumptions.
Question: What is your gender?
- Female
- Male
- Non-binary
- Other (please specify)
- Prefer not to answer
Pro tip: Always include a non-binary option and “prefer not to answer” to support inclusivity and privacy.
3. Race and Ethnicity
Race and ethnicity data provide insight into cultural backgrounds, values, and lived experiences, useful for ensuring inclusivity and relevance.
Question: What is your race or ethnicity?
- Black or African-American
- Hispanic or Latinx
- White / Caucasian
- American Indian or Alaskan Native / First Nations
- Asian
- Native Hawaiian or Pacific Islander
- Multiple races
- Other (please specify)
- Prefer not to answer
Pro tip: Align categories with your region’s census standards for consistency.
4. Education Level
Education level helps you understand literacy, socio-economic background, and communication preferences.
Question: What is the highest level of education you’ve completed?
- Less than high school
- High school diploma / GED
- Some college, no degree
- Associate degree
- Bachelor’s degree
- Master’s degree
- Doctorate (Ph.D., Ed.D., etc.)
- Professional degree (JD, MD)
- Prefer not to answer
5. Employment and Work Details
Employment details give essential context to financial stability, lifestyle, and decision-making power. Looking beyond simple employment status, by also considering job title, industry, work setup, and weekly hours, creates a much fuller picture of your audience.
Job titles and occupations enable precise segmentation, targeted audience, and psychographic profiling. Occupation often reflects lifestyle, values, and purchasing behavior.
Advanced survey analysis can even utilize natural language processing (NLP) to categorize open-text job title responses, grouping them into categories for easier reporting (e.g., “Software Engineer” and “Developer” are both mapped to “Technology”).
The work environment has become increasingly relevant with the rise of remote and hybrid setups. Knowing whether respondents work on-site, remotely, or in a hybrid model offers insight into their daily routines, which can affect commuting, media consumption, and spending habits.
Weekly work hours provide an additional layer of context. Long workweeks may correlate with higher income, but also with higher stress and less free time, while shorter workweeks may indicate lower income, but also more lifestyle flexibility.
Questions:
- What is your current job title or role? (open text)
- In which industry do you currently work? (open text)
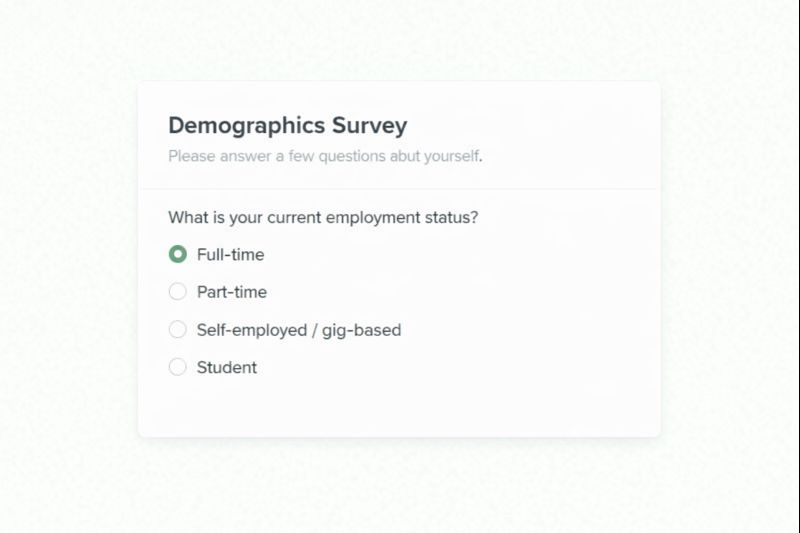
- What is your current employment status?
- Full-time
- Part-time
- Self-employed / gig-based
- Student
- Retired
- Homemaker / caregiver
- Unemployed
- Unable to work
- Prefer not to answer
- What is your work setup?
- Fully on-site
- Fully remote
- Hybrid (partly remote, partly on-site)
- Other (please specify)
- How many hours do you work weekly?
- Less than 10
- 10–19
- 20–29
- 30–39
- 40
- 41–49
- 50–59
- 60 or more
- I’m currently not employed
6. Household and Income
Household income refers to the total combined income of all members living in a single household, before taxes. This is one of the most important demographic measures because it directly relates to spending power, financial priorities, and eligibility for certain products or services.
Knowing the distribution of income within your audience helps you:
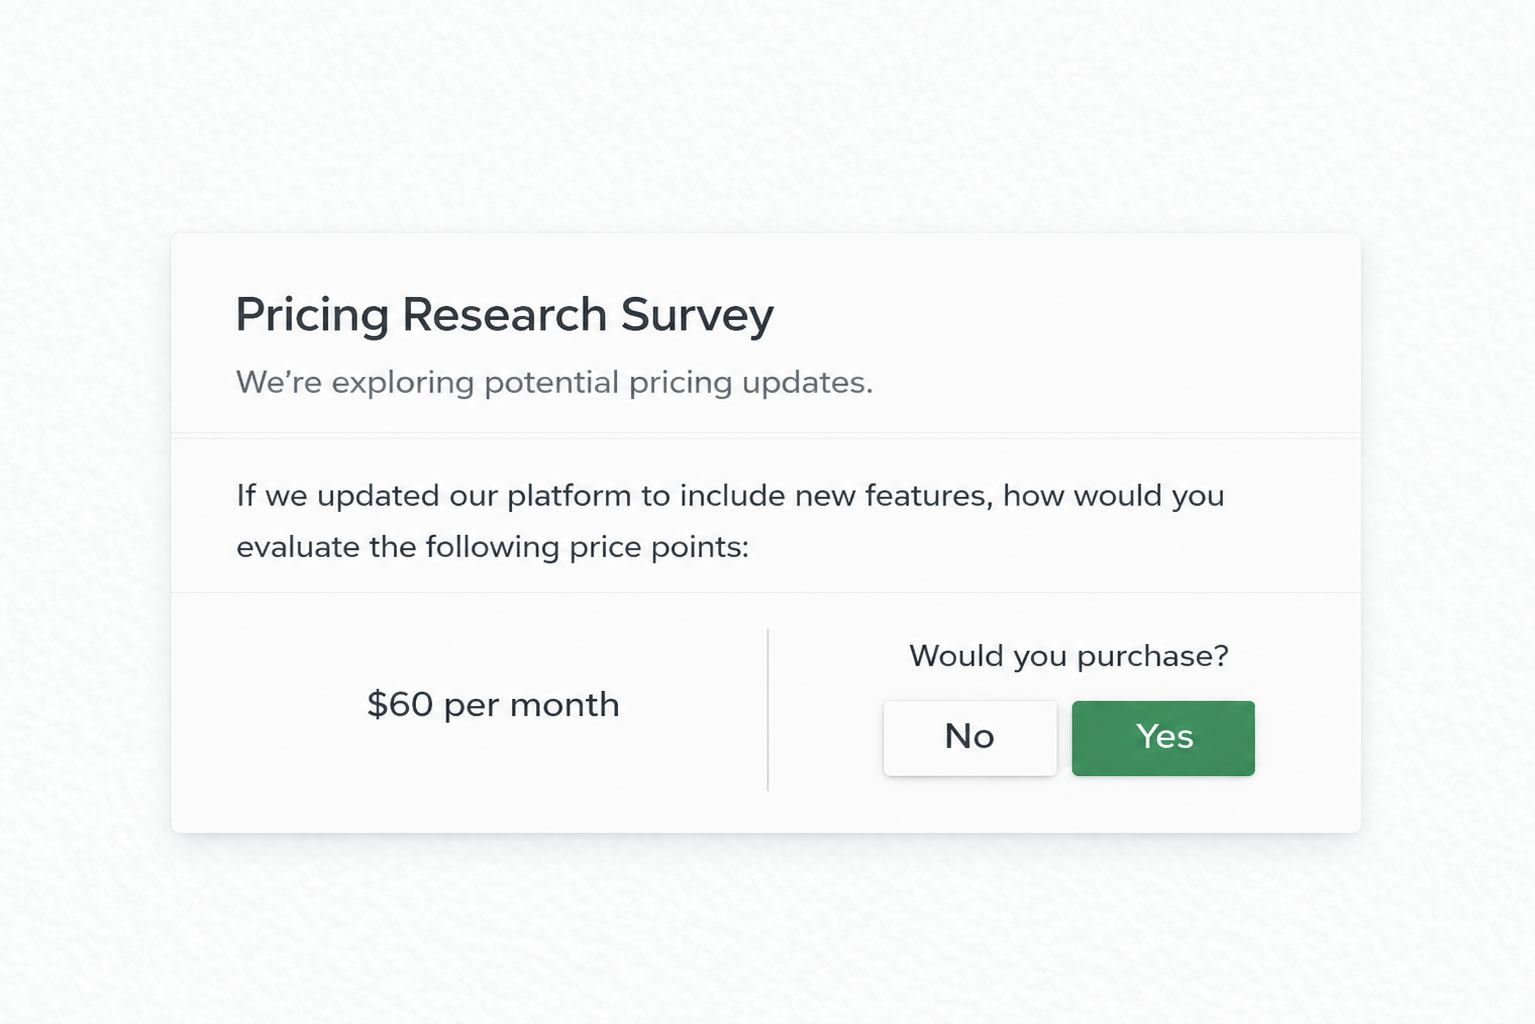
- Fine-tune pricing research
- Identify market segments that need budget-friendly options
- Better predict purchasing behavior
When asking about income, it’s best to provide ranges that are appropriate for your region. Ranges make the question less intrusive and encourage higher response rates compared to asking for an exact figure.
Household composition also matters. The number of people living together, the presence of children or dependents, and marital status all shape lifestyle choices, purchasing behavior, and long-term needs. These factors are especially important in sectors like housing, travel, insurance, and family-oriented products.
Finally, questions about housing add another dimension. Whether someone owns, rents, or lives with family, and what kind of dwelling they live in, provides clues about mobility, stability, and consumption habits.
Questions:
- What is your total annual household income before taxes?
- Less than $10,000
- $10,000–$19,999
- $20,000–$29,999
- $30,000–$39,999
- $40,000–$49,999
- $50,000–$59,999
- $60,000–$74,999
- $75,000–$99,999
- $100,000–$124,999
- $125,000–$149,999
- $150,000–$199,999
- $200,000+
- Prefer not to say
- How many people, including yourself, live in your household?
- 1
- 2
- 3
- 4
- 5+
- How many children under 18 live in your household?
- 0
- 1
- 2
- 3+
- Prefer not to answer
- What is your current housing situation?
- Own
- Rent
- Living with family
- Other (please specify)
- What type of housing do you live in?
- Single-family home
- Apartment or condo
- Townhouse
- Mobile home
- Other (please specify)
7. Marital or Relationship Status
Relationship status shapes household needs, spending habits, and lifestyle priorities.
Question: What is your current relationship status?
- Single
- Married
- In a domestic partnership / civil union
- Separated
- Divorced
- Widowed
- Prefer not to answer
8. Location or ZIP Code
Location is one of the most powerful demographic markers. A simple ZIP code unlocks a wealth of insights without asking respondents for overly detailed information like city and state, which can feel redundant or intrusive.
By collecting ZIP codes, you can link survey data to external datasets, such as the U.S. Census. This allows you to enrich responses with information on population density, average income, education levels, and urban vs. rural distribution, all without burdening respondents.
Question: What is your ZIP code?
Pro tip: Asking for a ZIP code is often all you need. It’s easier for respondents than typing the city and state. A single ZIP code can be combined with third-party data sources to enrich results with general information, such as income averages, housing types, or mobility trends, which can be used to build customer profiles in location intelligence software (explained in more detail below).
9. First Language
Language data helps with communication preferences, accessibility needs, and cultural relevance.
Question: What is your first language?
- English
- Spanish
- Chinese (Mandarin/Cantonese)
- Tagalog
- Vietnamese
- Arabic
- Korean
- Russian
- French
- Portuguese
- Haitian Creole
- Other (please specify)
- Prefer not to answer
10. Religion
Religion reveals values and traditions that may affect purchasing, policy, or lifestyle choices. Handle with sensitivity and always provide an opt-out.
Question: Do you identify with a religion or faith tradition?
- Christianity
- Judaism
- Islam
- Hinduism
- Buddhism
- None
- Other (please specify)
- Prefer not to answer
11. Political Views (optional)
Political affiliation can shape values and brand perception, but it’s highly sensitive. Use only if relevant to your research.
Question: Which of the following best describes your political views?
- Very liberal
- Somewhat liberal
- Moderate
- Somewhat conservative
- Very conservative
- Other (please specify)
- Prefer not to answer
12. Lifestyle and Habits
Lifestyle data goes beyond the basics, capturing day-to-day behaviors that influence purchasing, brand affinity, and segmentation. While demographics like age or income tell you who someone is, lifestyle data shows how they live. This can include fitness activity, media consumption, shopping behaviors, transportation choices, or technology use.
When layered with external datasets such as Experian Mosaic, lifestyle insights become even more powerful. These people datasets enrich survey results with details on discretionary spending power, likelihood to move, preferred shopping channels, and media preferences, giving you a complete view of your audience.
Questions:
- How many times a week do you exercise?
- Do you own or lease a car?
- Do you have reliable internet access at home? (Yes/No)
- Which devices do you use most often? (Phone, Laptop, Tablet, Desktop)
- How often do you use the internet each day?
- Less than 1 hour
- 1–3 hours
- 4–6 hours
- 6+ hours
- How do you usually get around?
- Personal vehicle
- Public transit
- Rideshare (Uber/Lyft)
- Walking/biking
- Other
Many researchers stop at basic demographics and miss this layer entirely, and most survey platforms don’t provide the tools to utilize lifestyle data. By going beyond the basics and combining survey responses with enrichment datasets, you unlock insights that directly drive targeting, product strategy, and growth.
To effectively operationalize these deeper insights, integrating product management software can help teams align enriched data with product decisions, ensuring more targeted development and accelerated growth.
Writing Good Demographic Questions
Writing demographic questions well is just as important as the topics you cover. Poorly worded questions can feel intrusive, confuse respondents, or yield unusable data. These best practices will help you draft clear, inclusive, and effective questions that you can add to this template.
1. Be Inclusive and Respectful
Use modern, neutral language. Avoid assumptions about gender, relationship status, or identity. Always include options like “Prefer not to say” or “Self-describe” so respondents feel comfortable answering.
2. Keep Wording Short and Clear
Phrase questions simply and avoid jargon. Short, direct wording improves comprehension across different reading levels, languages, and cultural backgrounds.
3. Provide Logical Answer Ranges
When asking about age, income, or hours worked, use non-overlapping ranges that make sense for your audience. This prevents confusion and ensures clean data.
4. Explain Why Sensitive Data Is Collected
With all personal and sensitive questions (especially questions on income, ethnicity, or health), it’s important to be transparent about why you’re asking and how you’re planning to use the data.
Include a brief privacy statement or note that clearly explains how responses will be stored, protected, and reported. For surveys in the U.S., make sure you comply with CCPA and other data minimization requirements. For E.U. respondents, ensure adherence to GDPR. Organizations should also consider continuous threat exposure management practices to identify and address potential vulnerabilities in how demographic data is stored and accessed.
5. Use Conditional Logic Where Appropriate
Draft questions so they can be skipped if irrelevant. Example: if someone selects student as their status, they shouldn’t have to answer questions about retirement planning. This keeps the survey relevant and respectful.
6. Standardize Open-Ended Fields
When drafting open-text questions (e.g., job title, industry), keep in mind they’ll need to be standardized later. Anticipate common variations and provide drop-downs or grouped options where possible.
Collecting Responses for Demographic Questions
How you collect demographic data is just as important as the questions you ask. The goal is to capture accurate information without overwhelming respondents, and these practices will help you get the most value from this template.
Collect across multiple channels. Don’t rely on a single survey to capture everything. Instead, spread demographic questions across different touchpoints:
- Website widgets and pop-ups can capture one demographic detail at a time while a visitor browses, helping you build small profiles gradually.
- NPS or feedback surveys are a natural place to add a demographic question or two without distracting from the main survey goal.
- QR code surveys work well on packaging, receipts, or in-store displays, giving customers a quick way to provide demographic information at the point of experience.
- Survey panels (or sometimes called targeted surveys) to increase sample size when your audience is too small. This allow you to capture more profound insights into lifestyle and regional factors. These enriched data points can then be linked with location intelligence software to identify new markets and expansion opportunities.
Use incentives carefully. Rewards like gift cards, discounts, or prize entries can improve response rates, but keep them small and relevant. If the incentive becomes the focus, you risk rushed or low-quality answers.
Build profiles progressively. You don’t need to ask every demographic question in one survey. Shorter surveys often yield higher-quality data, so it’s better to spread questions across multiple interactions and link them back to customer profiles in your CRM.
To make demographic insights reliable, you need to collect a representative sample in each subgroup to detect meaningful patterns. Small sample sizes can exaggerate differences or create misleading conclusions. As a rule of thumb, aim for at least 100 responses per key subgroup (e.g., age range, income bracket) if you plan to segment the data, though larger samples will provide greater statistical confidence.
Analyzing Demographic Question Data
The true value of demographic questions comes after the data is collected. They provide the context behind responses, helping you understand not only what people think, but who they are.
What the results from demographic questions reveal:
- Audience segmentation: Break results down by age, location, income, or education to compare how different groups respond.
- Product–market fit: For example, a coffee chain discovers households of 5+ people rarely visit, revealing a gap in family-friendly seating and menu options. Acting on this insight improves alignment with customer needs.
- Market research: Add questions like MaxDiff or pairwise comparison to understand what different groups value most, whether you’re evaluating product features, policy issues, or candidate messages. Segment results by region or ZIP code to see how priorities shift across audiences.
- Advertising strategy: A campaign for Gen Z should look and sound different from one for customers in their 40s. Demographic data ensures messaging matches the right audience.
- Location-based insights: ZIP codes highlight geographic trends. When combined with location intelligence tools, they can guide ad targeting, franchise expansion, or site selection.
How to Visualize Results
Turning numbers into visuals makes patterns easier to spot and explain:
- Income vs. NPS scatter plot → See how satisfaction differs across income brackets.
- Age-based heatmaps by ZIP code → Identify where specific age groups are concentrated.
- Work-from-home % by region → Highlight regional adoption of remote work.
- Gender vs. product usage bar chart → Show how engagement differs across identities.
- Household size vs. purchase frequency bubble chart → Reveal whether larger families buy more often or in bulk.
- Income vs. commuting time scatter plot → Spot correlations between earnings and travel habits.
- Age + location + device usage heatmap → Layer insights to see which groups prefer mobile, desktop, or tablet.
Good demographic analysis goes beyond simple counts and percentages. It connects patterns across groups, highlights meaningful differences, and surfaces insights that support clearer decisions, whether you’re refining messaging, developing new products, or choosing where to grow.
In practice, demographic data is used alongside financial modeling services to support forecasting, budgeting, scenario planning, and pricing decisions. Breaking results down by location or customer segment helps estimate demand, size markets, and understand how revenue and costs shift across different groups.
Demographic Questions + Location Intelligence Software
Demographic questions go beyond helping to analyze survey data. When paired with location intelligence software, they become a foundation for business strategy supporting market expansion, segmentation, and pricing. A single ZIP code can be linked to external datasets such as the U.S. Census or Experian Mosaic to reveal lifestyle factors like housing stability, mobility, shopping behavior, and discretionary spending power.
This enrichment helps you identify where similar customers are likely to be. For example, suppose your highest-value respondents are affluent families in suburban ZIP codes with high auto ownership. In that case, you can pinpoint other regions with the same profile and target them to expand your reach and increase revenue.
Key benefits of combining demographics with location intelligence:
- Market expansion opportunities: Spot underserved ZIP codes that match your best customer profile.
- Targeted advertising: Focus campaigns on areas with the highest alignment between demographics, lifestyle, and purchasing power.
- Sales forecasting: Use demographic + geographic trends to project future demand in specific markets.
- Local product strategy: Adjust offerings based on regional differences in income, household size, or commuting patterns.
- Site selection and planning: Guide store openings, franchise growth, or service coverage using population density, mobility data, and household composition.
Example: A fitness brand finds that happy customers cluster in ZIP codes with above-average income, long commutes, and strong adoption of health products. By enriching this insight with Experian Mosaic lifestyle segments, they can identify similar ZIP codes across the country, creating a roadmap for expansion and tailored marketing.
Beyond this survey template, SurveyKing also offers a user-friendly interface for exploring demographic data along with consulting services. Our team can help you run demographic enrichment reports, integrate third-party datasets, and translate raw survey answers into actionable business strategies.
For organizations ready to take the next step, CTO services provide the technical leadership to connect survey data with enterprise systems, student information systems, or CRM platforms. This often includes deploying surveys or website widgets to fill demographic gaps and link responses back to customer profiles, supporting location intelligence, financial modeling, and business insights.
Frequently Asked Questions
Below are answers to common questions about demographic surveys, how to structure them, and how to use the data they collect. These FAQs help clarify best practices and provide additional context for anyone customizing or analyzing a demographic survey template.
What is a demographic survey template?
It’s a prebuilt set of questions designed to collect details such as age, gender, income, education, occupation, and location. These questions follow accepted research principles, giving your survey structure and helping you generate clean, consistent data.
Which companies provide survey tools for demographic insights?
SurveyKing, SurveyMonkey, Qualtrics, Typeform, and Google Forms all offer tools to collect demographic insights. SurveyKing is unique because its demographic template connects directly to location-intelligence data, allowing users to find similar population profiles and run deeper segmentation.
Which question would a demographer most likely ask?
The single most likely question is “What is your age range?” because age is the base variable for almost all demographic analysis. But gender, income, education, or location are commonly asked.
How do you write demographic data in research?
You write demographic data by summarizing age, gender, income, and similar traits in short sentences or simple tables. Many researchers also segment results (for example, comparing two age brackets side by side). Tables and stacked bar charts work well for this and are supported by most survey platforms, including SurveyKing.
How do you ask about socioeconomic status on a survey?
You assess socioeconomic status by including questions about income, education, occupation, or employment. The goal is to identify categories of social position, access to resources, and lifestyle patterns.

Ready To Start?
Create your own survey now. Get started for free and collect actionable data.