Overview: Rating scales are used to measure feedback such as opinions, satisfaction, or likelihood on a defined scale. They typically use numbers (such as 1–5 or 1–10), descriptive labels (Poor to Excellent), or visual symbols such as stars. By converting feedback into structured data, rating scales make it easy to uncover trends and benchmark results.
Getting Started: This rating scale template opens a customizable survey with prebuilt questions, including 1–5 and 1–10 scales, multi-row ratings, Net Promoter Score (NPS), and other standard formats. Use it to quickly apply proven rating formats. This guide covers rating scale examples, use cases, and how to interpret results.
Rating Scale Examples
These rating scale examples are designed to help create your own study. This list includes common rating scale types, the different formats, and sample questions with typical scale labels.
| Scale Type | Question Type | Example Question | Scale Labels |
|---|---|---|---|
| Numerical | Single Rating | How satisfied are you with your recent purchase? | 1–5 (Very dissatisfied → Very satisfied) |
| Numerical | Multiple Rating | Please rate the following aspects of your work environment. | 1–5 satisfaction scale |
| Numerical (Loyalty) | Net Promoter Score (NPS) | How likely are you to recommend us to a friend or colleague? | 0–10 (Not at all likely → Extremely likely) |
| Numerical (Effort) | Customer Effort Score (CES) | How easy was it to complete this transaction? | 1–7 (Very difficult → Very easy) |
| Semantic Differential | Semantic Differential | How would you describe our product? | Easy ←→ Difficult |
| Descriptive | Multiple Choice (Ordered) | How would you rate the quality of support you received? | Poor, Fair, Good, Very Good, Excellent |
| Graphical | Star Rating | How would you rate your overall experience? | 1 to 5 Stars |
| Numerical / Descriptive | Matrix | Please rate the following statements. | Rows rated on 1–5 or labeled scale |
Rating Scale Types
Rating scales can be grouped into a few core families based on how responses are measured: numerical, descriptive, semantic differential, and graphical. Each family represents a different way of capturing intensity, attitude, or perception along a continuum.
Numerical Scales
A numerical scale uses numbers as the response options. The classic examples are 1–5, 1–10, or 0–10 ranges. Some rating scales like customer effort use 7-point ranges. These scales measure the intensity of a feeling or the likelihood of a behavior.
A Likert scale is a common type of numerical scale in which each number is paired with a labeled statement (e.g., Strongly Disagree to Agree Strongly). Although sometimes treated as a separate category, Likert scales are best understood as labeled numerical scales.
Net Promoter Score (NPS) is another well-known numerical scale. It uses a 0–10 scale to measure recommendation likelihood and applies a specific scoring method, but at its core, it remains a numerical rating scale.
Descriptive Scales
Descriptive rating scales use text labels instead of numbers, such as Poor, Fair, Good, and Excellent. These scales reduce ambiguity by clearly defining what each response option represents, improving consistency across respondents. These scales are often used when numeric precision is less critical than clarity or when respondents may interpret numbers differently.
Semantic Differential Scales
Semantic differential scales place two opposite adjectives at each end of a scale, such as Easy–Difficult or Friendly–Unfriendly. Respondents select a position between the two extremes, allowing researchers to capture subtle perceptions and attitudes. These scales are commonly used in branding, product testing, and usability research.
Graphical Scales
Graphical scales rely on visual elements rather than words or numbers. Common examples include stars, sliders, emojis, or smiley faces. They are quick to answer and highly engaging, especially in consumer-facing surveys. To avoid confusion, graphical scales are often paired with numeric or text anchors (for example, a 1–5 star scale with “Excellent” at the high end).
Other Considerations
Some survey question types are often mislabeled as rating scales, but they do not measure intensity along a continuum. Dichotomous questions (Yes/No) offer only binary choices and are not rating scales. Ranking questions ask respondents to order items relative to each other, measuring preference rather than intensity. These formats are valuable, but they serve different research purposes and should not be treated as rating scales.
Rating Scale Questions
Rating scale questions apply the core rating scale types (numerical, descriptive, semantic, and graphical) using different question formats. These formats determine how the scale is presented to respondents.
Across the SurveyKing platform, the 1–5 rating scale with a single rating format is the most commonly used scale. It offers a strong balance between simplicity, reliability, and comparability across teams and time periods.
Single Rating Scale
Use a single numerical scale to rate one statement or experience. A single row 1–5 scale works well for general satisfaction, training evaluation forms, employee surveys, and performance ratings. A 1-7 or 1–10 single scale can be useful when more differentiation is needed or when matching the format of a prior Likert study.
Multiple Rating Scale
Ask respondents to rate several related items using the same numerical scale. This format is optimized for mobile devices and commonly uses a 1–5 scale with optional anchor labels on either end.
Net Promoter Score (NPS)
Measure customer loyalty with the standard 0 to 10 “likelihood to recommend” question. While NPS uses a numerical scale, it applies a specific scoring methodology to classify respondents into promoters, passives, and detractors.
Customer Effort Score (CES)
Customer Effort Score measures how easy or difficult an experience feels for users. CES questions most commonly use a 1–7 scale, ranging from Very Difficult to Very Easy, though some implementations use 1–5 scales. CES is widely used for support interactions, onboarding flows, and task completion analysis, where reducing friction is a key goal.
Sliders
Present a numerical scale as an interactive slider, allowing respondents to select a value along a continuous range. Sliders are useful when precision or engagement is more important than exact numeric selection.
Matrix
Display multiple rating statements in a table format where respondents rate each row against shared column options. Columns can use numbers, text labels, or a combination of both, making matrix questions flexible for both numerical and descriptive scales.
Semantic Differential
The semantic differential scale captures nuanced attitudes by placing opposite adjectives at each end of a scale, such as Easy–Difficult or Friendly–Unfriendly, and asking respondents to select a position between them.
Multiple Choice (Ordered)
When you want a purely descriptive rating scale without numbers, use ordered multiple choice survey with options such as Strongly Disagree to Agree or Very Dissatisfied to Very Satisfied Strongly. While visually different, these questions still function as rating scales when responses follow a clear order.
When to Use a Rating Scale
Rating scales are instrumental when you want to turn subjective opinions into actionable data. Because rating scales are central to structured feedback, we include several standard rating scale variations in our questionnaire template to support consistent data collection across use cases.
Market Research
Companies often use rating scales to draft research questions and collect structured feedback on products, services, and customer or technical support experiences. Asking customers to rate satisfaction, likelihood to recommend, or customer effort helps teams understand what is working well and where improvements are needed. For example, a 1–7 customer effort score can quickly reveal how easy or difficult an experience feels for users.
Employee Surveys
Organizations use rating scales to conduct anonymous employee surveys measuring satisfaction, skills, and overall performance. Scales help managers provide consistent, measurable feedback, which can be used for promotions, training plans, and goal setting. For instance, a Likert scale assessing “communication skills” from “Needs Improvement” to “Excellent” allows clear comparison across team members.
Our team routinely uses rating scales in business consulting engagements focused on employee metrics. Some results were integrated into labor modeling tools to connect feedback with store-level productivity data and help companies optimize labor allocation, shift hours to where they’re needed most, and improve both efficiency and employee engagement.
Customer Feedback
After interactions with support teams, rating scales allow companies to assess service quality efficiently. A brief, structured survey asking, “How satisfied are you with our support today?” provides quick insights into areas of strength and areas for improvement.
The average score indicates how customers typically feel about your support. If you track ratings over time, you’ll see if changes in staffing, processes, or training have improved customer perception. Finally, ratings tied to individual support agents can identify who needs extra training and who deserves recognition.
Student Satisfaction
Educators use rating scales to evaluate student learning, participation, or course satisfaction. A scale from “Poor” to “Excellent” can help students self-assess their understanding or provide teachers with data on where to adapt their methods.
Using rating scales in all these contexts enables data-driven decision-making. By collecting structured feedback, you can:
- Identify trends,
- Compare performance over time, and
- Prioritize actions based on evidence rather than assumptions.
How to Create a Rating Scale
A rating scale works by guiding respondents through a structured process. You define what you want to measure, present the question in a clear format, and then analyze the results.
Here’s a step-by-step process to create a rating scale.
Step 1: Define the attribute you want to measure
Start by deciding exactly what you’re trying to capture. This could include customer satisfaction, employee performance, product usability, or the cleanliness of a hotel room. Once you know your attribute, it will be easier to design an effective scale.
Step 2: Choose the type of scale
Select the format that best fits your audience and goal. This could be a numerical scale, a descriptive (verbal) scale, a graphical scale, or a Likert-style agreement scale. Emojis or faces tend to work well with children, patients, and in multi-lingual settings, while Likert scales are better for opinions and attitudes.
Step 3: Decide on the scale length
Common choices are 3, 5, 7, or 10 points. Shorter scales are easier to answer quickly, but longer scales provide more nuance. The most important thing is to be consistent across related questions, making your analysis and comparisons easier.
Step 4: Write clear, specific, and focused questions
Write your questions in a way that makes them easy to understand. Ensure that each question addresses only one idea at a time. Avoid questions like “How satisfied are you with our price and customer service?” because they combine multiple concepts, making your data unreliable; you won’t know which factor influenced the score.
Closed-ended questions work best because they limit responses to the options you have defined.
Step 5: Label the response options clearly
If you use numbers, consider adding short labels such as “1 = Poor” and “5 = Excellent.” Clear labels help respondents interpret the scale consistently and reduce confusion.
Step 6: Collect responses
Once your questions are designed, distribute them through a survey, form, or application. Ensure the format matches the scale type, for example, use radio buttons for fixed points or a slider for a continuous scale.
Best Practices for Designing a Rating Scale
Rating scales may look simple, but the way you design them directly affects the quality and accuracy of the insights you’ll get. Here are some best practices to follow:
Keep Scales Consistent
The direction of your scale should be uniform throughout your survey. For example, if 1 represents “Poor” and 5 means “Excellent” on one question, don’t flip it for another question. Inconsistent scales can confuse respondents and distort your data.
Choose an Appropriate Scale Length
Most rating scales work best with five to seven points. Shorter scales are quicker for respondents to answer, while slightly longer scales allow for more nuanced opinions. Avoid excessively long scales, as they can be overwhelming and reduce response quality.
Be Careful About Biased Wording.
Each response option should be easy to understand and written in neutral language. If you use words that sound positive or negative, you risk influencing the respondent’s choice.
For example, instead of asking, “How great was our service?” (which presupposes a positive experience), use the neutral phrasing, “How would you rate our service?” Avoid negative framing, such as “How bad was the wait time?” A more balanced version would be, “How would you rate the wait time?”
Offer a Midpoint or NA
When you include a neutral choice, such as “Neither agree nor disagree”, “Neutral,” or “I don’t know”, it allows respondents who feel indifferent to answer honestly. You can also add an option for not applicable. This can improve data accuracy and prevent forced responses that do not accurately reflect honest opinions.
Ensure Visual Design is Accessible
No matter if you use numbers, words, or symbols, your scale should be easy to read and understand. In terms of design, avoid cluttered layouts and confusing graphics, and consider accessibility for respondents who are colorblind or visually impaired.
Pilot Test Your Scale
Test your survey with a small group before sending it to your whole audience. This will give you the chance to identify any confusing wording, imbalance, or technical issues. This way, you’ll be able to adjust based on feedback to make your scale as clear and effective as possible.
Keep the Survey Simple
Avoid overwhelming respondents with too many rating scale questions. Keep the survey focused and on point, and balance closed-ended ratings with open-ended feedback. For example, when using a Net Promoter Score question, it’s common to add a follow-up asking respondents why they gave their score. Open-text responses can then be analyzed with natural language processing to identify themes and problem areas, without requiring detailed questions for every single interaction or touchpoint.
Analyzing Rating Scale Data
Collecting ratings is only half the job. What really matters is how you interpret them. Here are some ideas:
- Descriptive statistics – Calculate basic measures such as the mean, median, and mode to summarize your data. For example, the average satisfaction score can give a quick snapshot of overall customer sentiment.
- Frequency distribution – If you examine the percentage of respondents that selected each option, you’ll understand the spread of responses and be able to identify which ratings are most common.
- Cross-tabulation – You can compare responses across different demographic or behavioral groups. For instance, you might realize that Gen Z customers rate a product differently than Millennials, or that employees in other departments report varying levels of satisfaction.
- Trend analysis – Track changes in responses over time to identify improvements or declines. Depending on what you’re measuring, these trends can help you plan product updates or policy changes.
- Benchmarks – When using a Net Promoter Score question, you can compare your score against other companies and industry standards. Depending on the type of rating scale, SurveyKing also provides external benchmarks. For example, training feedback surveys include benchmark data, allowing you to compare your results with those of other trainers and organizations.
Rating Scale Alternatives
Rating scales are versatile, but there are situations where other question types may provide better insights. Alternatives to rating scales are most effective when you require insights that extend beyond a simple score. Here are some rating scale alternatives to consider:
- Open-ended questions – When you need more detailed, qualitative feedback that people can provide in their own words. One caveat — you’ll need more effort to analyze them.
- Ranking questions – You ask respondents to order items based on preference or importance. For example, “Rank these product features from most to least valuable.” Ranking questions reveal priorities but do not indicate how strongly someone feels about each option. Sometimes rating and ranking get confused, but they are separate question types.
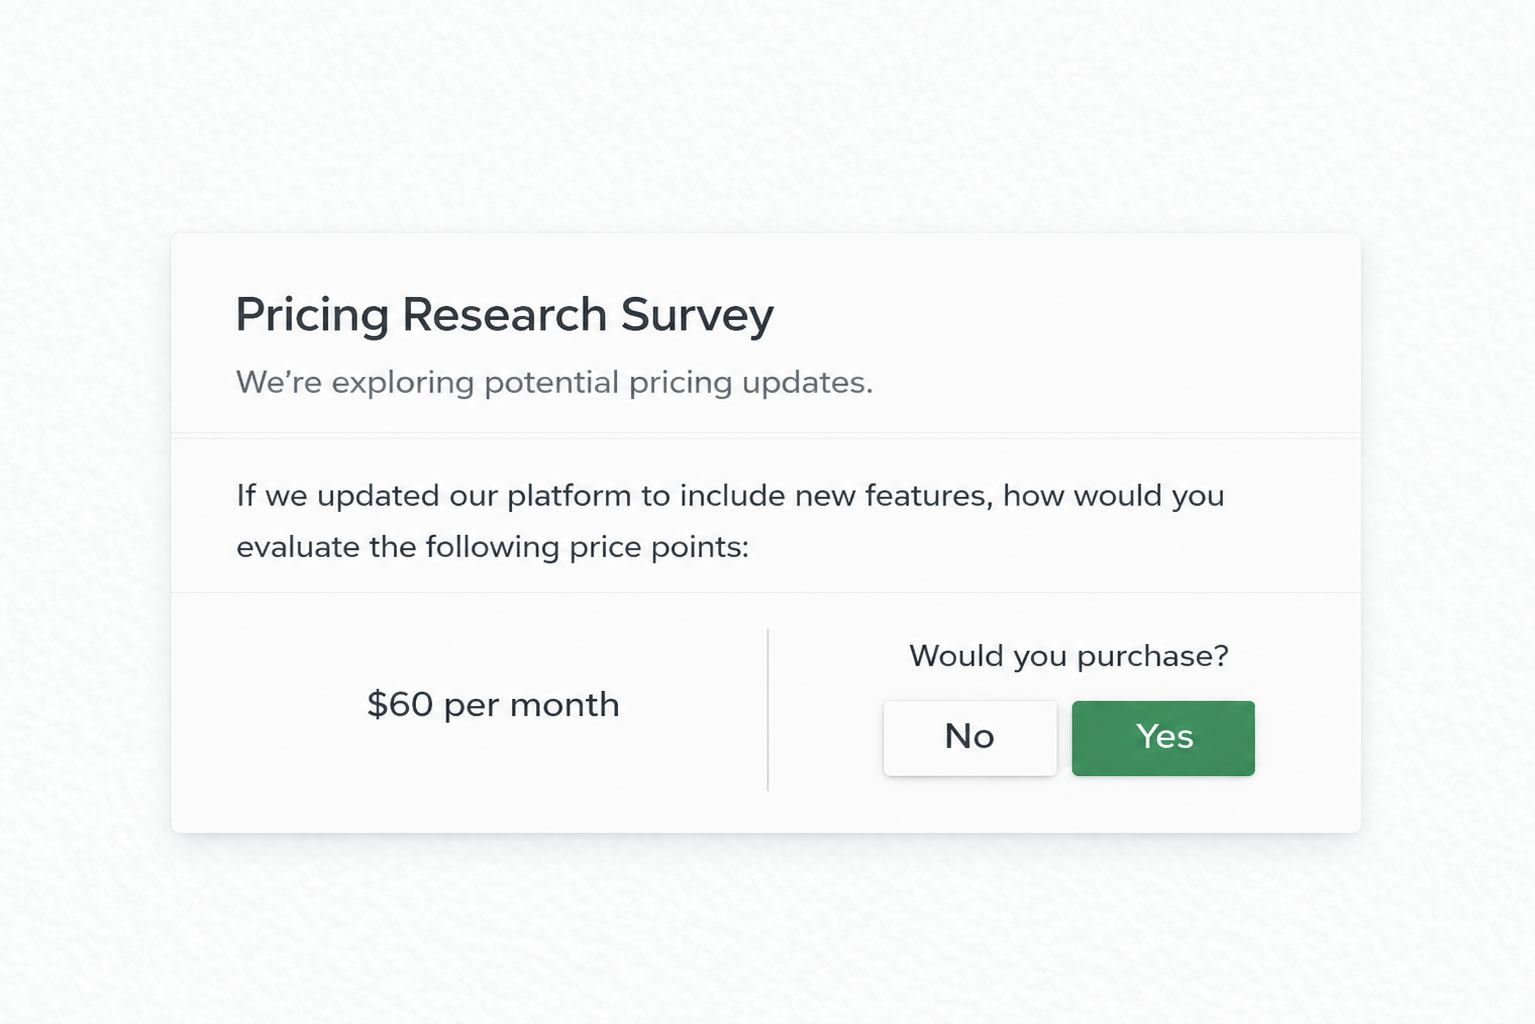
- Yes-No questions – Useful for quick, clear-cut insights when you need straightforward answers, such as “Did you find our service helpful?” On the flip side, they don’t tell you why someone answered the way they did, or how strongly they feel about it.
- Pairwise – presents two items at a time and asks respondents to choose between them. By repeating this across multiple pairs, you can build a reliable preference ranking. It works well when you need to compare many options but want to keep the question format simple for respondents.
- MaxDiff – asks respondents to pick the most and least essential options from a set. Instead of rating everything on the same scale, they make trade-offs, which reveals true priorities. This method avoids the “everything is important” bias and produces more precise and actionable results.
Pairwise and MaxDiff are the formats that are often meant, or should be, when others talk about product or market research “rating comparisons.”
Frequently Asked Questions
Below are answers to some of the most common questions about rating scales, how they work, and how to use them effectively in surveys.
What is the “How likely would you recommend” scale?
The “How likely would you recommend” question is most commonly used as part of the Net Promoter Score (NPS). It asks respondents to rate how likely they are to recommend a company, product, or service on a 0–10 scale, ranging from Not at all likely to Extremely likely. This scale is widely used for customer loyalty measurement and benchmarking, and it is sometimes applied in employee surveys.
How do you interpret rating scale questions?
Rating scale responses are often summarized using averages or distributions, but interpretation depends on how the scale is labeled. The key insights usually come from benchmarking comparing results internally over time, across teams or locations, or externally against industry benchmarks. This is especially common for standardized use cases such as training feedback, customer satisfaction, and employee engagement.
How do you create a rating scale?
The easiest way to create a rating scale is to start with a straightforward question and a consistent set of scale labels. Survey templates are often used because they include standard formats such as single- and multiple-ratings, matrix questions, Net Promoter Score (NPS), and Customer Effort Score (CES), helping teams quickly apply best practices.

Ready To Start?
Create your own survey now. Get started for free and collect actionable data.