A research question defines what a study investigates. Strong research questions generate actionable insights by prioritizing options, comparing alternatives, and identifying areas for improvement. They can be answered using surveys, behavioral metrics, sales data, experiments, or external data sources.
How to Write a Research Question
A good research question reduces ambiguity and bias and ensures the data you collect supports decision-making. A strong research question should:
- Clearly define what is being measured
- Rely on data or structured comparison, not personal opinion
- Use neutral wording that does not assume an outcome
- Measure a single outcome so results are clear and interpretable
- Directly inform a decision or next step
Here is an example of a strong and weak research question related to physical activity.
Strong research question: How does weekly physical activity frequency relate to reported stress levels in adults?
Weak research question: Does exercise help people feel better?
The strong question defines specific variables, uses neutral wording, and can be answered with measurable data. In contrast, the weak question is vague, subjective, and lacks a clear outcome or evaluation method.
Write Your Research Question Below
Write your research question below to evaluate clarity, scope, measurable outcomes, and its readiness for data collection and analysis. This tool will identify weaknesses and improve your research design.
Research Question Examples
The examples below are grouped by research category to show how questions are written across different types of studies and contexts.
Academic Research Questions
Academic research questions aim to explore relationships, test hypotheses, or explain behavior. They’re typically broader, more neutral, and designed for statistical analysis rather than immediate decision-making.
- To what extent does the frequency of social media use correlate with reported levels of anxiety in adolescents aged 13–18?
- Which local policy factors are most strongly associated with changes in voter turnout across U.S. counties?
- What are the lived experiences of first-generation college students navigating the financial aid process?
- How does the introduction of a four-day workweek affect objective productivity metrics in software engineering teams?
- On a scale of 1 (Strongly Disagree) to 5 (Strongly Agree), how much do you agree with the statement: “I feel supported by my academic advisor?”
Public Opinion Research Questions
Public opinion research and political polls focus on understanding attitudes, priorities, and trade-offs related to policies, institutions, or social issues. These questions are used to measure public sentiment, identify areas of consensus or disagreement, and inform policy or civic decision-making.
- Which of the following policy areas matters most to you, and which matters least?
- How strongly do you support or oppose the implementation of this policy in your community?
- Of the following issues, which should be prioritized first, and which should be prioritized last?
- Which socio-economic factors are the strongest predictors of voter turnout in municipal elections?
Business Research Questions
Business research focuses on answering practical operational and leadership questions. These questions often combine survey data with internal data and systems, such as labor models, to translate demand into staffing, cost, and execution decisions.
- Which potential locations show the highest projected demand relative to cost and competitive presence?
- Which operational tasks take the most time to complete?
- Where do delays most frequently occur in our core processes?
- How does demand volume affect required staffing levels?
- Which KPIs best indicate whether the business is performing well or falling behind?
Market Research Questions
Market research questions help you understand demand, positioning, and the competitive landscape. They focus on market trends, preferences, and unmet needs, which makes them a valuable tool for providing big-picture insights.
- How has consumer demand for plant-based meat alternatives changed in the Midwest over the last 24 months?
- How do foot traffic volume, median household income, and competitor density relate to store performance across regions?
- When considering a new home security system, which of these brands comes to mind first?
- Which market segment represents the largest untapped opportunity for high-end fitness wearables?
- Of the following features, which would be most important for you to have, and which would be least important?
- At what price would you consider this product so expensive that you would not buy it?
While standard rating scales are useful for measuring sentiment, trade-off–based questions are often more effective when prioritization or pricing decisions are required.
Product Research Questions
These questions focus on understanding how users interact with specific features or services, and what to improve next.
- Between Feature A and Feature B, which would you prefer if you could only have one?
- If this product were available today, how likely would you be to replace your current solution with it?
- On a scale of 1–5, how easy or difficult was it to complete the device’s initial setup?
UX Research Questions
UX research questions are designed to uncover software usability issues, cognitive friction, and emotional responses throughout the user journey.
- Where on the homepage did you expect to find the “Settings” menu?
- Using the current navigation bar, how long does it take you to find the checkout button?
- Which of these two landing page layouts feels easier to follow?
- On a scale of 1–7, how easy was it to complete this task?
Customer Research Questions
Customer research focuses on loyalty, retention, service quality, and overall experience. These questions are used in both customer and consumer research to understand not just what people feel, but why and what to fix next.
- You can use different question types here:
- How likely are you to recommend our company to a friend or colleague?
- To what extent do you agree or disagree with the statement: “The customer support representative resolved my issue quickly”?
- Which part of the delivery process contributed most to your overall satisfaction: packaging, delivery speed, or tracking updates?
- Thinking about your most recent interaction, what is the one thing we could have done to make your experience better?
Employee Research Questions
Employee research questions help organizations identify engagement gaps, process inefficiencies, and cultural risks before they become retention problems.
- How well do your current tools and software support your daily tasks?
- How frequently do you feel that your immediate supervisor recognizes your contributions?
- Which professional development opportunity would you be most likely to utilize this year?
- Would you recommend this company to family or friends?
Research Question Formats
Some research questions are easier to answer using a specific approach. Different formats help measure sentiment, force trade-offs, or evaluate pricing and effort. The question formats below are commonly used in survey-based research, but the underlying concepts apply broadly and can help you understand how different types of questions drive the data you collect.
| Research Goal | Example Question | Format | When to Use |
|---|---|---|---|
| General research | Which best describes your professional background? | Multiple choice | Segmentation and baseline analysis |
| Measure sentiment | How satisfied are you with your current tools for doing your job? | Rating scale (1–5 or 1–7) | Tracking satisfaction or change over time |
| Measure loyalty | How likely are you to recommend our company to a friend or colleague? | Net Promoter Score (NPS) | For customer or employee loyalty |
| Research priorities | Which of the following areas is most important to improve, and which is least important? | MaxDiff | When ranking importance or making roadmap decisions |
| Compare alternatives | If you could only choose one option, which would you prefer? | Pairwise comparison | When options are limited and direction matters |
| Research bundled concepts | Which of these product concepts would you be most likely to choose? | Conjoint analysis | When evaluating trade-offs across features and pricing |
| Test price sensitivity | Would you purchase this product at a price of $49? | Gabor Granger | When estimating demand at specific price points |
| Quantify price perception | At what price would this product feel too expensive to consider? | Van Westendorp | Identifying acceptable pricing ranges |
| Diagnose friction | How easy or difficult was it to complete this task today? | CES (1- 7 effort scale) | Spotting inefficiencies in workflows |
Not all research questions map cleanly to a single format or method. Complex decisions often require multiple research questions and data sources.
For example, market research for expansion may draw on customer demand surveys, pricing research, sales data, and external demographic or location data. In these cases, multiple research questions help break a complex decision into measurable components.
This template includes examples of each format to help structure a study. Results can also be combined with other data sources, such as sales or behavioral data, to support decision-making.
Multiple Choice Questions
Multiple choice questions present respondents with a fixed set of options and ask them to select one or more answers. They are one of the most widely used research question formats because they are quick for respondents to complete and easy to analyze.
These research questions work best when you already understand the likely range of answers and want to measure distribution, frequency, or segmentation.
Common uses include:
- Categorizing behaviors or preferences
- Identifying primary reasons or barriers
- Segmenting responses by role, experience level, or usage pattern
An example would be:
Which of the following best describes your primary reason for using our product?
- To save time
- To reduce costs
- To improve accuracy
- To comply with regulations
- Other (please specify)
Multiple choice questions are often paired with a follow-up open-ended question to capture context when respondents select “Other.”
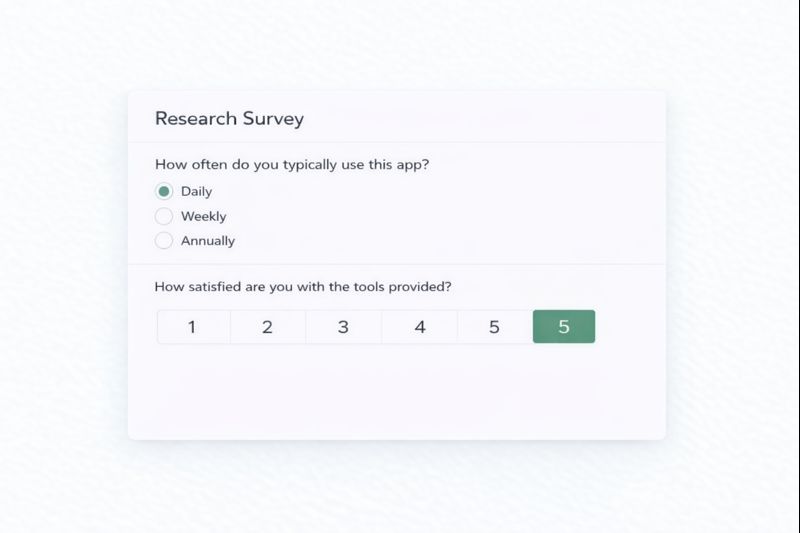
Rating Scales
Rating scale questions ask respondents to evaluate something on a numerical or descriptive scale (e.g., 1–5 or 1–7). They are the most common research question format for measuring attitudes, perceptions, and experiences in both academic and applied research.
For example, if you’re conducting customer research, you can ask, “On a scale from 1 to 5, how satisfied are you with our ticket response time?”
These questions are central to both academic and applied research because they produce standardized, comparable data. Typical applications include:
- Measuring satisfaction, confidence, or agreement
- Tracking change over time
- Comparing perceptions across demographic segments
Because rating scales use consistent numeric values, they’re well suited for benchmarking and comparison across groups or over time. They’re commonly used for employee sentiment, training evaluations, and standardized feedback, and support analysis using averages, trends, and group comparisons.
Open-Text
Open-text questions allow respondents to answer in their own words. While they require more effort to analyze, they are essential for understanding motivation, reasoning, and nuance.
They are most effective when used as follow-ups to structured questions rather than as standalone survey items. For example, You rated your experience as a 6 out of 10. What is the main reason for that score?
Common use cases include:
- Explaining NPS or satisfaction scores
- Understanding why a feature was chosen or rejected
- Identifying unexpected themes or pain points
In larger studies, open-text responses can be analyzed using natural language processing (NLP) to tag themes, detect sentiment, and identify the reasons behind specific scores or choices.
Net Promoter Score (NPS)
NPS measures loyalty by asking respondents how likely they are to recommend a product, service, or organization on a 0–10 scale, for instance, “How likely are you to recommend our company to a friend or colleague?”
While the score itself is helpful for benchmarking, its real value comes from the open-ended follow-up.
NPS is commonly used to:
- Track customer or employee loyalty over time
- Identify promoters, passives, and detractors
- Prioritize retention or experience improvements
Without a follow-up question, NPS tells you what people feel, but not why.
MaxDiff
MaxDiff presents respondents with small sets of items and asks them to choose the most and least important option in each set. For example, respondents might be shown a group of features and asked: “Which of the following features is most important to you, and which is least important?”
This forces clear trade-offs and eliminates the tendency for respondents to rate everything as “important.”
MaxDiff is especially useful for:
- Feature prioritization
- Message or value proposition testing
- Identifying what truly drives choice
Because it produces relative importance scores, MaxDiff is more reliable than rating scales when prioritization matters.
Pairwise Comparison
Pairwise comparison questions present two options at a time and ask respondents to choose between them. Respondents might be asked: “If you could only choose one, which would you prefer: Feature A or Feature B?”
This approach simplifies complex decisions and is useful when evaluating trade-offs.
Pairwise comparison is often used to:
- Compare features or concepts
- Narrow down competing ideas
- Validate directional preferences
While simpler than MaxDiff, pairwise questions still provide strong insight when the number of items is limited.
Conjoint Analysis
Conjoint analysis evaluates how respondents make decisions when multiple attributes are combined into realistic scenarios. Instead of asking about features individually, respondents choose between bundles of features, such as in the following question: “Which of the following plans would you be more likely to choose?” where each option includes a different combination of features, pricing, and service levels.
Conjoint analysis is commonly used for:
- Product and packaging design
- Feature trade-off analysis
- Pricing and plan optimization
It helps researchers understand not just what people like, but how they make decisions when faced with real-world constraints.
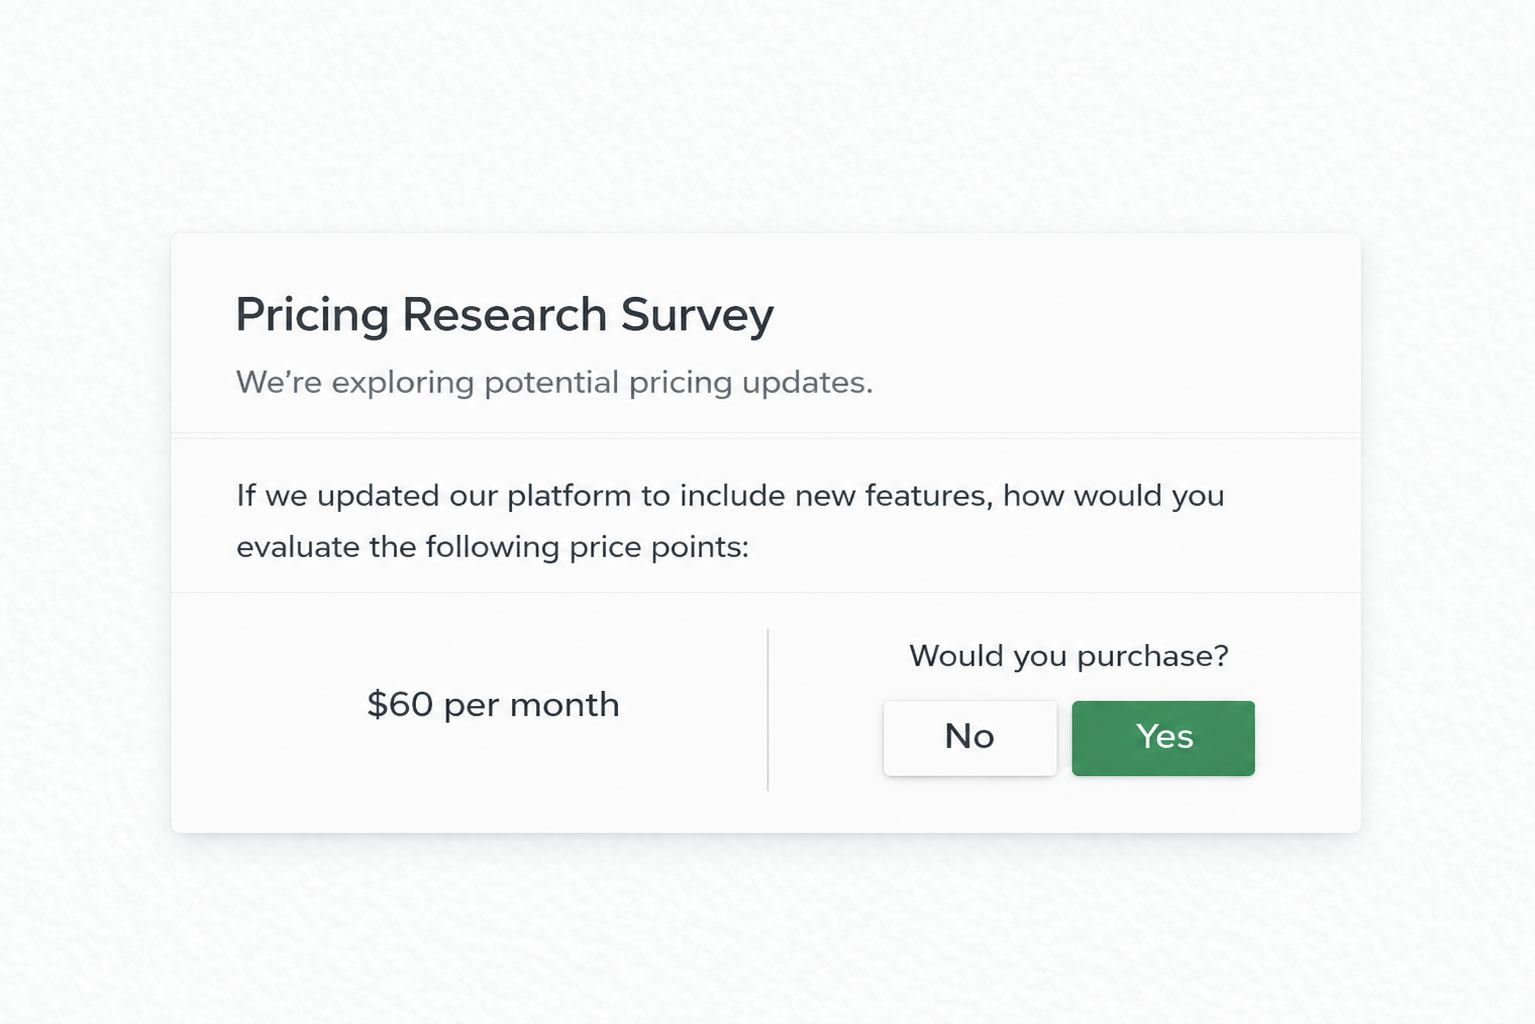
Gabor Granger
Gabor Granger pricing measures willingness to pay by asking respondents whether they would purchase a product at a given price. For example: “Would you purchase this product at a price of $49?”
Prices are adjusted up or down based on responses.
This method is helpful for:
- Testing price sensitivity
- Estimating demand at different price levels
- Comparing pricing across segments
It works best when evaluating a single product or plan rather than complex bundles.
Van Westendorp
Van Westendorp pricing identifies acceptable price ranges by asking respondents four perception-based questions about pricing (too cheap, cheap, expensive, too expensive).
Van Westendorp is used to:
- Establish pricing boundaries
- Understand perceived value
- Identify psychological price thresholds
Unlike Gabor Granger, it focuses on perception rather than purchase intent.
Customer Effort Score (CES)
The Customer Effort Score measures how easy or difficult it was for someone to complete a task, typically on a 1–7 scale. For example: “How easy was it to resolve your issue today?” where 1 = very difficult and 7 = very easy.
CES is commonly applied to:
- Customer support interactions
- Onboarding and setup experiences
- Self-service workflows
Lower effort is strongly associated with higher satisfaction and loyalty, making CES a powerful diagnostic tool when friction is a concern.
How to Collect Survey Responses
When a research question requires direct input from people, surveys remain the most flexible and scalable way to collect data. The methods below outline common ways to distribute surveys and collect actionable responses.
Not all research questions are answered using surveys; some rely on experiments (such as A/B testing), observational data, administrative records, or external datasets like census, location, or transaction data.
Survey Panels
Survey panels provide fast access to pre-profiled respondents and are best suited for research that requires scale, targeting, and statistical confidence. They are commonly used for market research, product validation, and pricing research where representativeness matters.
Panels allow you to control for demographics, behaviors, and firmographics, making them especially effective for MaxDiff, Conjoint, and price sensitivity research. If your decisions depend on comparisons across segments, panels offer the most consistent and efficient path to insight.
Survey Links
Survey links are used when responses need to be associated with specific users, groups, or systems. They are commonly used in product, customer, and operational research where tracking responses over time, segmenting results, or following up with respondents is important. Survey links support more controlled distribution and deeper analysis while still providing a simple experience for respondents.
Anonymous Surveys
Anonymous surveys are ideal when reach and honesty matter more than strict sampling control. They are widely used in academic, employee, and community research where respondents may be reluctant to share identifiable feedback.
Because anonymity reduces social desirability bias, this method often produces more candid responses, particularly for sensitive topics like satisfaction, workload, or organizational culture.
QR Codes
QR code surveys remove friction at the moment feedback matters most. By allowing respondents to scan and respond instantly, they make it easier to capture reactions while the experience is still fresh, before details fade or motivation drops.
They are particularly effective in physical or shared environments like events, public spaces, transit systems, campuses, and community outreach initiatives. When participation needs to be fast, contextual, and convenient, QR codes consistently outperform traditional distribution methods like follow-up emails or paper surveys.
Embeds
Embedded surveys and triggered pop-ups capture feedback directly within a product, website, or software, making responses highly contextual and behavior-driven.
This makes them especially effective for UX and customer experience research, such as triggering a Customer Effort Score after a support interaction or collecting feedback during onboarding. Because respondents are reacting in the moment, these methods reduce recall bias and surface points of friction that are often missed in post-hoc surveys.
Interpreting Research Results
Interpreting research results is the process of turning data collected to answer a research question into clear insights and actionable steps. It goes beyond summarizing responses to explain what the results mean, how options compare, and what decision the evidence supports. The goal is to translate analysis into defensible conclusions that guide next steps.
Simple Counts
Begin by understanding what is most common and what stands out. Frequency counts, percentages, and basic distributions quickly reveal dominant behaviors, priorities, and pain points. This step establishes a baseline for interpretation and often surfaces the most important insights before any advanced analysis is needed.
Filter and Segment
Aggregated results can hide meaningful differences. Segmenting responses by role, experience level, usage frequency, demographics, or geography often reveals patterns that averages alone miss. This is especially important in market, product, and employee research, where different groups can experience the same product, service, or process in very different ways.
Question types like MaxDiff and Conjoint become significantly more powerful when paired with proper segmentation. These approaches often rely on techniques such as regression and cluster analysis to identify distinct groups, uncover preference drivers, and understand differences in purchase intent or feature prioritization across segments.
Crosstabulation
Cross-tabs are a simple way to compare how different groups answered the same question. Instead of looking at one overall average, they break results into side-by-side segments so you can see where opinions, behaviors, or outcomes differ.
Cross-tabs are powerful because they reveal differences that averages hide, explain why overall results look the way they do, and help teams avoid one-size-fits-all decisions. In practice, many of the most actionable insights in market, product, and employee research come from simple cross-tabs, not complex models.
Export Data
Research data is rarely analyzed in just one place. Exporting results to Excel or CSV makes it easier to run custom calculations, combine datasets, and share findings across teams.
For larger or recurring studies, API access allows results to feed directly into reports and dashboards, making it possible to track trends over time and use research as a continuous input into decision-making—not a one-off exercise.
Analyze Open-Text
Open-text feedback adds critical context to structured survey questions, especially when paired with metrics like NPS, helping explain why scores are high or low. Using a small number of quantitative questions alongside open-text responses helps keep surveys short while still capturing detailed feedback that fixed-choice questions can’t fully explain.
To analyze open-text data effectively, focus on recurring themes and patterns rather than isolated or emotionally charged comments. In larger datasets, natural language processing (NLP) can systematically tag themes, detect sentiment, and link qualitative feedback to quantitative scores, making it easier to identify what’s driving results and where improvements will have the most significant impact.
Geographical Analysis
Some research questions are best answered visually by analyzing results across geography. Location-based analysis helps identify regional patterns, concentration effects, and gaps that are difficult to see in tables alone.
- Visualizing demand, satisfaction, or priorities by location when deciding where to open a new store
- Identifying areas of high or low performance relative to population density or foot traffic
- Comparing survey results against nearby competitors or service coverage
- Mapping public opinion or issue priority by region in political or civic research
- Spotting geographic trends that explain why results differ across markets or communities
Frequently Asked Questions
The questions below clarify common terms and misconceptions related to research questions and survey design.
What Is a Focus Question?
A focus question is a research question written to concentrate attention on a single, clearly defined concept or objective. In applied research, focus questions are used to limit scope, reduce ambiguity, and ensure that the data collected is easy to interpret and analyze.
While the term is commonly used in educational settings, the same principle applies to market, product, and UX research: a focused question avoids broad or exploratory wording. Instead, it targets one behavior, outcome, or decision at a time.
What Is a Red Herring Question?
A red herring question is a quality-control mechanism used in research and surveys. These questions are designed to identify inattentive or low-quality respondents who are not carefully reading or engaging during a study. Common examples include attention checks, obvious instructions, or references to non-existent brands or options.
The term red herring also appears in logic and debate literature, where it refers to an irrelevant argument that distracts from the main issue. That meaning is largely academic and separate from how the term is used in applied research.

Ready To Start?
Create your own survey now. Get started for free and collect actionable data.