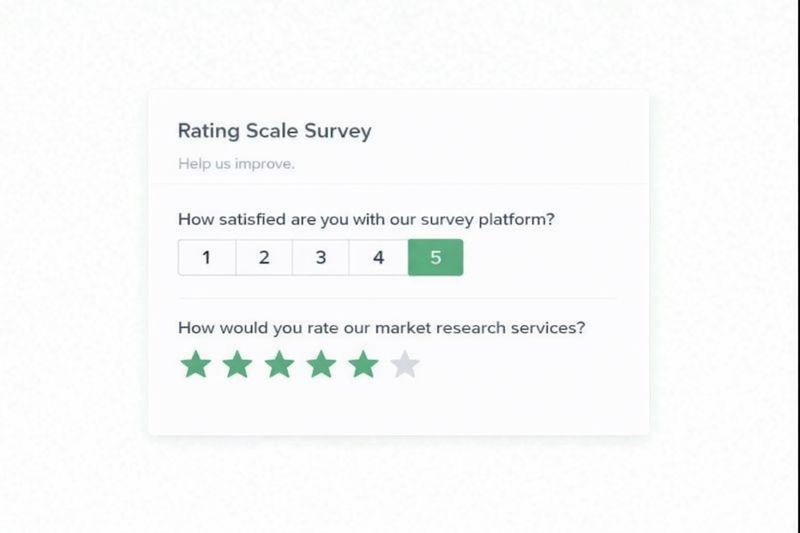
A 1 to 5 rating scale measures opinions, perceptions, or attitudes using a five-point format. The scale progresses from negative to positive, with 1 labeled as (Lowest/Worst), 3 as (Neutral), and 5 as (Highest/Best). The 1–5 rating scale is one of the most widely used rating formats in satisfaction surveys, feedback forms, personality assessments, and research studies.
This template opens a customizable survey with common rating scale formats. It’s designed to help you quickly apply proven rating scales. This guide covers examples, use cases, and how to interpret results.
Rating Scale 1-5 Examples
1–5 rating scales are essential for research questions that measure attitudes, perceptions, and experiences. Below are common rating scale examples.
Five-star ratings most closely map to satisfaction and quality scales, where higher stars reflect greater satisfaction or perceived quality.
Advantages of 1-5 Rating Scales
The rating scale 1-5 is popular for several compelling reasons:
Universal Recognition
The 1–5 scale is universally recognized across cultures and contexts. It mirrors five-star rating systems used by platforms like Uber, Airbnb, Amazon, and the Apple App Store, making it instantly familiar to respondents. Because people already know how to use a five-point scale, it reduces confusion and lowers cognitive effort.
Simplicity and User-Friendliness
Respondents can quickly understand and complete 1-5 scales with minimal cognitive effort. The straightforward numeric progression makes it accessible to individuals across various demographics and education levels. This simplicity leads to higher completion rates and more reliable data.
Balance and Neutrality
The 5-point scale provides a balanced range of response options, from clear negative to clear positive, with moderate positions in between and a neutral midpoint. This structure makes it easy for respondents to choose an option that reflects the strength of their opinion, whether it’s an extreme view, a moderate leaning, or neutrality.
Quantifiable Results
Unlike open-ended questions, rating scales produce standardized numerical data that can be easily aggregated, averaged, and analyzed. This quantification enables statistical analysis, benchmarking, and trend identification over time.
Benchmarking is essential for monitoring performance and driving improvement. A consistent 1–5 scale allows you to set internal benchmarks, measure change over time, and evaluate progress objectively. When using a rating scale on SurveyKing, external benchmarking is available, such as comparing training evaluation form results against anonymized datasets.
Effective for Mobile Surveys
The 1–5 scale performs well on small screens, making it a strong fit for mobile-first surveys. Fewer response options reduce friction and allow respondents to answer quickly without scrolling or zooming, which helps improve completion rates. SurveyKing supports compact multi-row 1–5 rating formats that group related statements in a mobile-friendly layout, reducing screen clutter while keeping questions easy to answer.
When to Use Rating Scales 1-5
The rating scale 1-5 format can be effectively applied in various survey contexts:
Customer Experience Measurement
For measuring customer satisfaction and experiences, 1-5 scales provide clear benchmarks that can be tracked over time. Specific applications include:
- Product satisfaction ratings
- Service quality evaluations
- Website or app usability assessments
- Post-purchase feedback
- User experience
Employee Feedback
Organizations can gather structured anonymous employee feedback using 1-5 scales to measure:
- Job satisfaction
- Management effectiveness
- Workplace culture perceptions
- Training program evaluations
- Work-life balance assessments
Shorter scales, such as 1–3, are sometimes used in team performance reviews to group outcomes into simple tiers (for example, below, meets, or exceeds expectations). While easy to apply, these scales offer limited resolution and are less effective for tracking improvement or benchmarking over time than a 1–5 scale.
Market Research
Researchers use 1-5 scales in market research to quantify consumer perceptions and attitudes:
- Brand perception studies
- Product feature evaluations
- Advertising effectiveness measurement
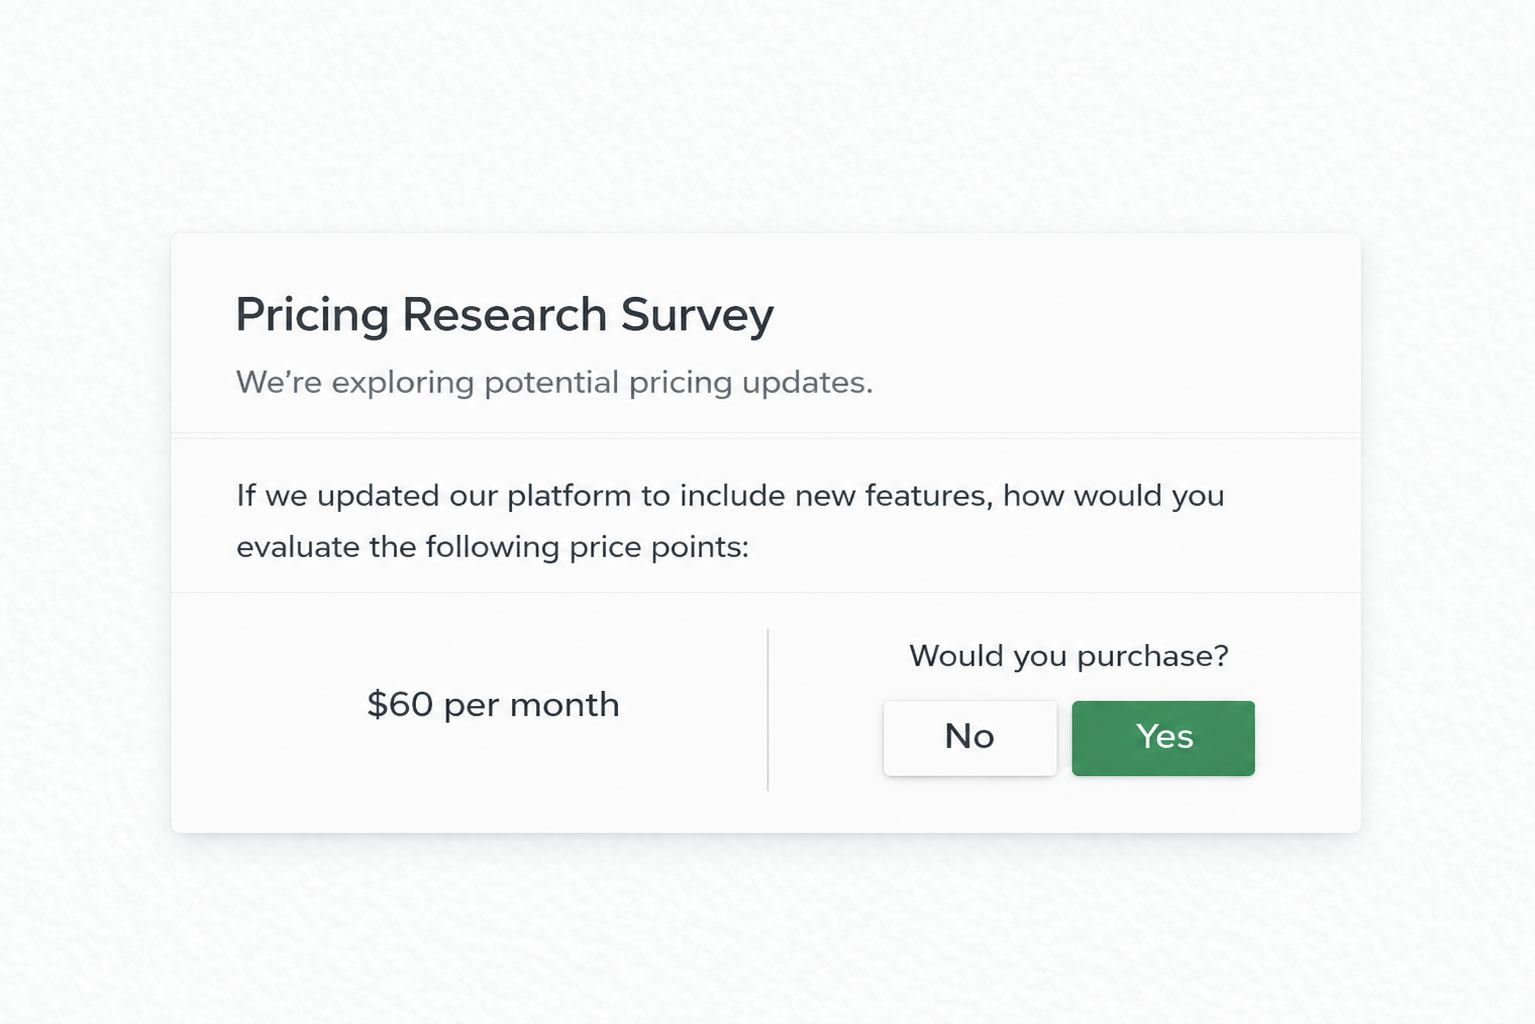
- Purchase intention assessments
Academic Research
In academic settings, these scales help quantify subjective responses:
- Psychological assessments
- Student evaluations of teaching
- Course satisfaction surveys
- Research participant feedback
Operational Monitoring
Beyond feedback and opinions, 1–5 rating scales are used to assess operational conditions where precise instrumentation isn’t available. These ratings help teams identify issues quickly, prioritize action, and track condition changes over time.
Common examples include:
- Equipment condition ratings
- Store cleanliness scoring
- Process reliability assessments
- Internal system usability and stability
In operational environments, ERP software development services integrate these ratings directly into systems, feeding dashboards, workflows, and maintenance processes to support planning, prioritization, and reporting.
Rating Scale Formats
When designing a rating question, you make two structural decisions: how the scale is labeled and whether respondents rate a single item or multiple related items. Most surveys rely on either numerical (end-anchored) scales or fully labeled scales. Each format affects clarity, mobile usability, and how responses are interpreted.
Numerical Rating Scales
Numerical rating scales apply text labels only to the two polar ends of the scale, while the numbers in between remain unlabeled. The labels should move in a clear directional order from lowest to highest intensity, such as Strongly Disagree to Strongly Agree. The intermediate numbers represent a gradual movement between those two anchors.
This format is widely used for measuring satisfaction, likelihood, and performance. Because it avoids labeling every step, it keeps the layout clean and reduces visual overload. Numerical scales are especially effective on mobile devices and in high-volume feedback environments.
Use this format when:
- Measuring satisfaction, likelihood, or intensity
- You want a clean, minimal layout
- Speed and simplicity are priorities
- You plan to benchmark or trend results over time
Fully Labeled Rating Scales
Fully labeled rating scales assign descriptive labels to each response option. Each level has a defined meaning rather than relying solely on numeric progression. These scales are commonly used for measuring agreement, perception, and attitudes.
Because every response must be labeled, fully labeled scales require either a multiple-choice format or a matrix question format.
Fully labeled scales improve interpretability and reduce ambiguity, particularly in research-focused or academic settings where wording precision matters.
Use this format when:
- Measuring agreement or attitudes
- Clear interpretation at every level is required
- You are running formal or academic research
- Response wording consistency is important
Single-Item Rating Scales
A single-item rating scale presents a single question at a time and asks respondents to evaluate it independently. This format is commonly used for overall satisfaction, overall performance, or likelihood to recommend, as with Net Promoter Score.
Single-item questions are straightforward and maintain respondent focus. Numerical scales are most often used in this layout, though fully labeled multiple-choice versions are also possible.
Use this format when:
- Measuring overall impressions
- Keeping surveys simple
- Each item needs focused attention
- Mobile performance is critical
Multi-Item Rating Scales
Multi-level rating scales allow respondents to rate several related items using the same scale, often grouped under a shared theme (such as product features, service attributes, or team dynamics).
While traditional matrix questions can use different scale lengths, 1–5 scales work best for multi-row formats. Larger scales and dense grids often perform poorly on mobile and increase respondent fatigue. For this reason, SurveyKing’s multi-row rating format defaults to a simple 1–5 structure and avoids complex matrix layouts.
Use this format when:
- Comparing related attributes
- Evaluating multiple aspects of a product or service
- Consistency across items is important
- Structured side-by-side analysis is needed
Best Practices for 1-5 Rating Scales
To maximize the effectiveness of your rating scale 1-5, consider these best practices:
Use Consistent Labeling
Rating scales should use clear, consistent anchors so respondents understand what each end of the scale represents. In most surveys, labeling the endpoints and, optionally, the midpoint is sufficient and more efficient than labeling every value. What matters most is consistency, for example, using the same Strongly Disagree to Agree or Poor to Excellent anchors throughout the survey.
Consider Scale Direction
While traditionally 1 is associated with negative responses and 5 with positive ones, some researchers prefer reversing this order. Whatever direction you choose, clearly communicate it to respondents and maintain consistency throughout your survey.
Balance Scale Points
Ensure your scale has an equal number of positive and negative options surrounding a neutral midpoint. This balance helps prevent bias and gives respondents a fair range of choices.
Provide Clear Instructions
Include clear instructions on how to use the scale, especially if your survey includes different types of rating questions. For example: “Please rate your level of agreement with each statement on a scale from 1 (Strongly Disagree) to 5 (Strongly Agree).”
Group Related Questions
When using multiple rating scale questions, group related items together to create a cohesive flow. This approach makes it easier for respondents to compare related items and provide consistent ratings.
Include Opt-Out Options When Appropriate
For questions that may not apply to all respondents, consider adding a “Not Applicable” or “Don’t Know” option outside the 1-5 scale. This prevents respondents from selecting the neutral option when they actually have no basis for judgment.
Keep Question Wording Neutral
Avoid leading or biased language in your questions. Neutral wording ensures you’re measuring genuine opinions rather than guiding respondents toward a particular response.
Common Mistakes to Avoid
Despite their simplicity, rating scales 1-5 can be implemented poorly. Here are some things to avoid:
Central Tendency Bias
Respondents often avoid extreme ratings (1 or 5) and gravitate toward the middle option (3). To mitigate this:
- Use clear language that distinguishes between scale points
- Consider using a 4-point scale when a neutral option isn’t necessary
- Include open-ended follow-up questions to clarify neutral responses
Acquiescence Bias
Some respondents tend to agree with statements regardless of content. You can minimize this by:
- Including a mix of positively and negatively worded questions
- Varying question formats throughout your survey
- Using validation questions to check for consistent responses
Scale Length Overload
Too many consecutive rating scale questions can lead to respondent fatigue. To prevent this, do the following:
- Limit the number of rating questions
- Break up rating questions with other question types
- Use progress indicators to show the survey completion status
- Use a multi-row rating scale to group common ratings using a single, combined scale
Inconsistent Scale Interpretation
Different respondents may interpret the scale differently. This issue can be avoided by:
- Clearly labeling each point on the scale
- Providing examples when appropriate
- Using consistent language throughout
The Neutral Option
Including a neutral (3) option allows respondents to indicate genuine uncertainty or lack of opinion, which can improve accuracy when people don’t clearly feel positive or negative. If a large share of responses are neutral, it may signal that the question needs to be more specific or that respondents aren’t familiar enough with the topic to give a clear rating.
Analyzing Rating Scale 1-5 Data
Once you’ve collected your rating scale data, here’s how to extract meaningful results:
Basic Analysis Techniques
- Calculate mean scores – The average rating provides a quick overview of the central tendency. For example, an average satisfaction score of 4.2 indicates a generally positive sentiment. It’s important to acknowledge that the 1-5 data rating scale is ordinal, not interval. This influences the choice of statistical tests. While calculating means is common practice, it’s technically more appropriate to use non-parametric statistics in some cases. Most survey platforms include an Excel export with the rating data. We offer Excel consulting services if you need help organizing or quantifying results.
- Examine response distribution – Look beyond averages to understand how responses are distributed across the scale. A bimodal distribution (peaks at both high and low ratings) might indicate divergent opinions among different respondent groups.
- Benchmarking results – Rating scales make benchmarking simple, enabling consistent tracking over time. Comparing average scores across periods helps identify trends and measure the impact of changes. External benchmarking depends on available data sources, but is typically based on annual averages.
- Create percentage-based metrics – Convert raw scores into percentage-based metrics for easier communication. For example, calculate the percentage of respondents who selected 4 or 5 (Top-2-Box score) as an indicator of positive sentiment.
- Clean your data – As mentioned, watch for respondents who straight-line their answers meaning they select the same rating (e.g., all 4s) across all items. This can occur in both single and multi-level rating scales. Straight-lining is often a sign of disengagement or satisficing and should be addressed during your data cleaning process. These responses should generally be removed before starting your analysis. Also, consider identifying speeders (respondents who complete the survey swiftly). In many cases, straight-liners and speeders overlap; removing them together significantly improves data quality.
Advanced Analysis Approaches
- Segment analysis – Break down results by demographic or behavioral segments to identify patterns. For example, satisfaction ratings can be compared between different age groups or customer types.
- Correlation analysis – Examine relationships between ratings on different questions. For instance, does product quality rating correlate with the likelihood to recommend?
- Gap analysis – Compare importance ratings with performance ratings to identify areas where expectations aren’t being met. This helps prioritize improvement efforts and highlight workflows that can benefit from business process automation, eliminating inefficiencies across both internal operations and customer-facing processes.
- Statistical significance testing – When comparing groups or time periods, use statistical tests to determine if differences are significant or merely due to random variation.
When using rating-scale data, the surrounding data often needs to be organized as well. Customer lists may be inconsistent, older studies might use different scales or naming conventions, and Excel exports from past surveys can be messy or incomplete. To make current and historical results comparable and to build reliable benchmarks, our data-cleaning services standardize fields and resolve inconsistencies.
Row-by-Row vs. Group Analysis
There are two primary approaches to analyzing rating scale data:
Row-by-row analysis examines each respondent’s pattern of answers across multiple rating questions:
- Consistency checking – Identify respondents with inconsistent patterns (potential data quality issues).
- Individual profiles – Create typologies of respondents based on rating patterns.
- Outlier identification – Find respondents with unusual response patterns for further investigation.
Group analysis aggregates ratings across all respondents:
- Item-by-item averages – Compare average ratings across different questions.
- Composite scores – Combine related items into a single score (requires reliability testing.)
- Dimension reduction – Use factor analysis to identify underlying dimensions of related items.
Visualization Techniques for Ratig Scale Data
Effective visualization helps communicate rating scale results. A box and whisker plot is particularly valuable for 1-5 rating data as it shows:
- The median (middle value)
- The interquartile range (middle 50% of responses)
- The range of responses
- Any outliers
Box plots are especially useful when:
- Comparing distributions across different groups
- Identifying skewness in your data
- Visualizing variability and central tendency simultaneously
- Looking for outliers that might be distorting averages
For example, two questions might have the same mean score of 3.5, but very different distributions; one might be tightly clustered around 3.5, while another might have responses spread across the entire scale. A box plot makes these differences immediately apparent.
Creating a 1-5 Rating Scales
When building a survey from scratch or modifying a question, follow these implementation tips:
1. Choose the Right Question Type
SurveyKing offers several rating scale formats:
- Single rating questions for individual items
- Matrix rating scales for multiple related items
- Mobile-optimized Likert scales for better user experience
2. Customize Scale Labels
Tailor your scale labels to match your specific research question. While standard labels work well, customized options might better fit your context.
3. Consider Visual Elements
Enhance understanding with visual cues:
- Color gradients (red to green)
- Star ratings for satisfaction questions
- Emoji scales for emotional responses
4. Set Up Skip Logic
Create personalized survey paths based on rating responses. For example, trigger follow-up questions when respondents give low ratings to understand the reasons behind their dissatisfaction.
5. Collect Responses
The way you distribute your survey can significantly impact response rates and data quality. Try:
QR code distribution:
- Create a custom QR code survey
- Customize the design to match your branding
- Place on receipts, product packaging, in-store displays, or event materials
- Track scans to measure engagement from different physical locations
Email distribution:
- Send personalized email invitations with embedded survey links
- Schedule automated reminders for non-respondents
- Track open and completion rates to optimize timing
- Use anonymous collection methods for sensitive feedback
Website/app integration:
- Embed the survey directly on your website or app
- Use pop-up or slide-in survey invitations based on user behavior
- Target specific user segments based on their activities
- Consider timing (e.g., post-purchase, after service completion)
Text message (SMS) distribution:
- Send short survey links via text for immediate feedback
- Use when targeting mobile users or seeking in-the-moment responses
- Keep surveys extremely short for this distribution method
- Consider the timing carefully to avoid being intrusive
Pro tip: For all distribution methods, ensure the first question is engaging and easy to answer to improve overall completion rates.
1-5 Rating Scale Usage Metrics:
Since September 2024, the five-point rating scale has been the most popular format on SurveyKing, used in 81% of all rating questions.
A major driver of this trend is our unique multiple-row rating scale, optimized for mobile devices. This format alone was used to collect answers for 2,394 rating statements, making it twice as popular as traditional single-statement rating questions (1,290).
Even when isolating just the single rating questions, the results were clear:
- 1–5 and 0–10 rating scales were nearly tied, each used about 46% of the time
- However, only 6% of users manually chose a 10-point scale (e.g., 0–10 or 1–10)
This told us something important: 1–5 isn’t just popular; people actively choose it over the default. So, we made a change! SurveyKing now defaults to 1–5 for all single-row rating-scale questions.
| Scale Type | Scale Count | Percentage |
|---|---|---|
| 1-5 Multiple Rating Scale | 2,394 | 65% |
| Default (0–10) | 590 | 16% |
| Manual (0-10) | 9 | 1% |
| 1-10 | 62 | 2% |
| 1-5 | 589 | 16% |
| 1-7 | 40 | 1% |
| Totals | 3,684 | 100% |
Likert vs Rating Scales
The term Likert scale comes from Rensis Likert’s 1932 research on measuring attitudes using labeled agreement options, often on a 7-point scale. Today, the term is used to describe many rating scales, even when they measure satisfaction or performance and only label the endpoints. SurveyKing supports both simple rating scales and fully labeled Likert-style questions.
Alternatives to Rating Scale 1–5
Some survey goals require a format beyond rating scales, while others require a scale beyond 1–5. These alternatives exist because they capture specific types of feedback or because a particular methodology or industry standard applies.
As a general rule, use a 1–5 scale for general ratings, and rely on other formats only when the research goal clearly calls for them. Even early research by Rensis Likert showed that simpler 1–5 scoring methods produced nearly identical results to more complex scales, supporting the use of shorter scales in practical survey design.
Net Promoter Score (NPS)
Net Promoter Score uses a 0–10 scale to measure loyalty and advocacy, not satisfaction or performance. It segments respondents into promoters, passives, and detractors and is widely used because of strong external benchmarks. NPS works best as a standalone metric rather than a replacement for general rating questions.
Customer Effort Score (CES)
Customer Effort Score is typically measured on a 7-point scale to assess how easy or difficult the experience felt. It focuses on friction and effort, which standard satisfaction ratings may not capture well. CES is most useful when effort is the primary outcome and external benchmarks matter.
7-Point Rating Scales
A 7-point Likert scale is most commonly used in academic research or when a study requires slightly more sensitivity than a 1–5 scale. In practice, it’s typically chosen to align with a prior study, academic framework, or existing benchmark. Outside of comparability requirements, the added options rarely improve insight and can slow response.
10-Point Rating Scales
A 1–10 rating scale is sometimes used when finer numeric differentiation or compatibility with an existing 1–10 benchmark is required. While familiar to some audiences, 1–10 scales often increase cognitive load and reduce the use of extreme values. For most general rating use cases, the added granularity rarely provides more actionable insight than a 1–5 scale.
Binary Scales
For simple yes/no assessments, a binary scale can reduce complexity:
- Yes/No questions
- True/False statements
- Agree/Disagree options
Semantic Differential Scales
These scales place opposing adjectives at each end of a continuum:
- Unfriendly ←→ Friendly
- Difficult ←→ Easy
- Unreliable ←→ Reliable
MaxDiff Analysis
Sometimes a simple rating scale isn’t enough, especially when you want to uncover preferences rather than just perceived importance.
For example, in an employee survey asking respondents to rate the importance of pay, paid time off, and schedule flexibility, most people will likely rate all three as “important.” That’s not very helpful if your goal is to identify what matters most.
This is where Maximum Difference Scaling, also known as MaxDiff, comes in handy. Instead of rating each item individually, MaxDiff forces respondents to make trade-offs by choosing the most and least essential items in a set. This helps reveal prioritized preferences, giving you much clearer insight into what people truly value.
Pairwise Comparison
When you have a long list of attributes, asking respondents to rate each one individually can lead to fatigue, straight-lining, and results in which everything is labeled “important.” Pairwise comparison offers a simpler alternative.
Respondents are shown two items at a time and asked to choose the one they prefer. After enough comparisons, the survey identifies which attributes consistently win, producing a clear priority ranking. Pairwise yields unique insights, such as preference data. It’s a practical middle ground between 1-5 ratings and full research methods like MaxDiff.
Use pairwise over a rating when:
- You have 6–20 attributes
- A long list of 1–5 ratings would be overwhelming
- You want better discrimination between items, but don’t need the full statistical power of MaxDiff
- Respondents may struggle with significant matrix questions or complex ranking tasks
Ranking Surveys
While not as advanced as MaxDiff, ranking surveys offer a simple way to collect ordered input. Instead of rating each item individually, respondents are asked to arrange a short list based on what stands out most to them.
Ranking works well for quick feedback on straightforward topics, such as:
- Picking a vacation destination
- Choosing themes for an event
- Ordering features in a product roadmap
- Selecting menu options for a catered event
It won’t tell you how much more someone favors one item over another, but it still forces clear decisions. That makes it more useful than a basic rating scale, where everything tends to score the same.
Slider Scales
For visual appeal and precise measurement, slider scales allow respondents to select any point along a continuous scale rather than choosing from fixed options.
Sliders can use different scale ranges (e.g., 0–100 or 1–10) and may be presented as either single-item or multi-row formats. However, they can be clunky on mobile devices, where fine adjustments are harder and sliders may not respond well to touch.
Use sliders when visual engagement or high precision is essential, but always test them on mobile before deploying widely.
Frequently Asked Questions
How do I create a 1–5 rating scale survey?
To create a 1–5 rating scale survey, start with a straightforward question, define what each number represents, and choose your labels (e.g., “Disagree” to “Agree”). You can use a matrix question with labels for each option, a single rating scale with labels on each end, or, unique to SurveyKing, a multi-row rating scale optimized for mobile devices.
What does a 1–5 rating scale from poor to excellent mean?
This version of the rating scale uses 1 as “Poor” and 5 as “Excellent.” It’s ideal for evaluations where respondents rate overall satisfaction, quality, or performance, and is commonly used in employee, customer, or training feedback.
Is there a template for a 1 to 5 rating scale?
Yes. SurveyKing provides a free 1–5 rating scale survey template you can customize. It includes single rating, multi-row, and matrix question types, making it easy to apply rating scales and adapt them to your study needs.
What is a multiple choice rating scale?
A multiple-choice rating scale uses predefined answer options displayed vertically. For example, a 1–5 “Poor to Excellent” question would show five separate choices stacked in a list. This format takes up more space and becomes harder for respondents to complete if they need to rate multiple statements. A horizontal rating scale, either single or multi-row, is more compact, user-friendly, and optimized for mobile devices.
What types of rating scales are used in education?
The 1–5 rating scale is the most common in education because it is simple, consistent, and easy to benchmark. For facility and course evaluations, schools can compare ratings across classes, instructors, and semesters, and align results with external benchmarks such as SurveyKing or public sources like Rate My Professor. For broader feedback, institutions sometimes use Net Promoter Score (NPS, 0–10) to measure student engagement, retention, and likelihood to recommend a program or school.

Ready To Start?
Create your own survey now. Get started for free and collect actionable data.